Analytics Basic: Practice Analytics
- Get Started
- Automations
- Patient Channel
- Patient Facesheet
- Collaborative Inbox
- Lines & Resources Requests
- Lines, Events, Resources
- Analytics
- Platform Settings and Configuration
- Users and Groups
- Campaigns
- SMS Basics
- Troubleshooting and FAQ
- Conversation Builder
- Add-Ons
- Release Notes
- Technical Specifications
- Referrals
- Self-Rescheduling
- Recalls
- Marketplace
- Conversation Manager
Table of Contents
Accessing Practice AnalyticsAvailable DashboardsKPIsMessaging AnalyticsPatient Response Time (PRT)Message and Patient Reach ChartsAdmin Messaging BreakdownAppointment AnalyticsAppointment CountsPatient ActionsExplore key Practice metrics that demonstrate the effectiveness of Artera while helping you discover opportunities for improvement. This article discusses the embedded Practice Analytics Dashboard, click here to learn about Enterprise Analytics.
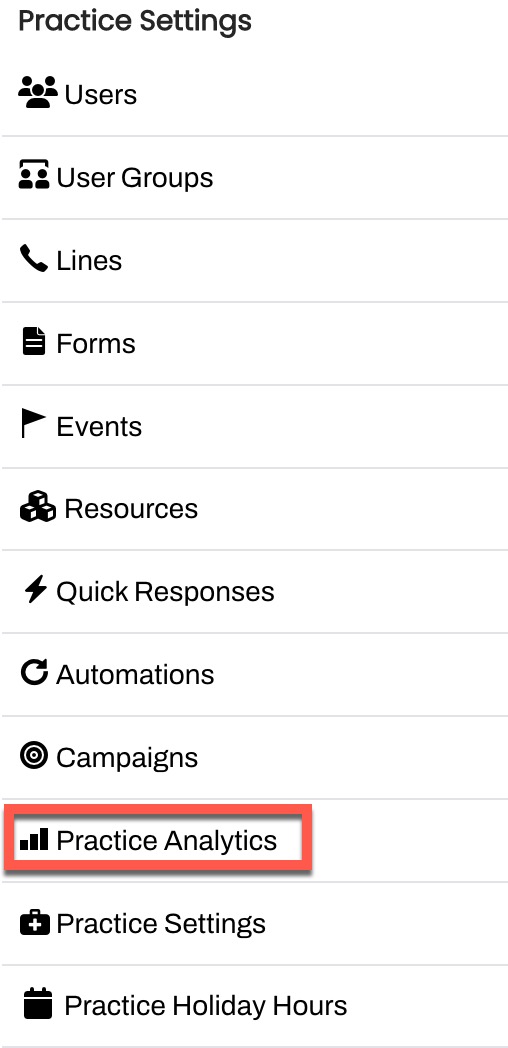
Accessing Practice Analytics
Access Practice Analytics from the Practice Settings menu:
Available Dashboards
The following dashboards are designed to provide valuable data insights into your Practice productivity without leaving Artera:
KPIs
This report displays Practice data and can pull in data for a specified time frame:
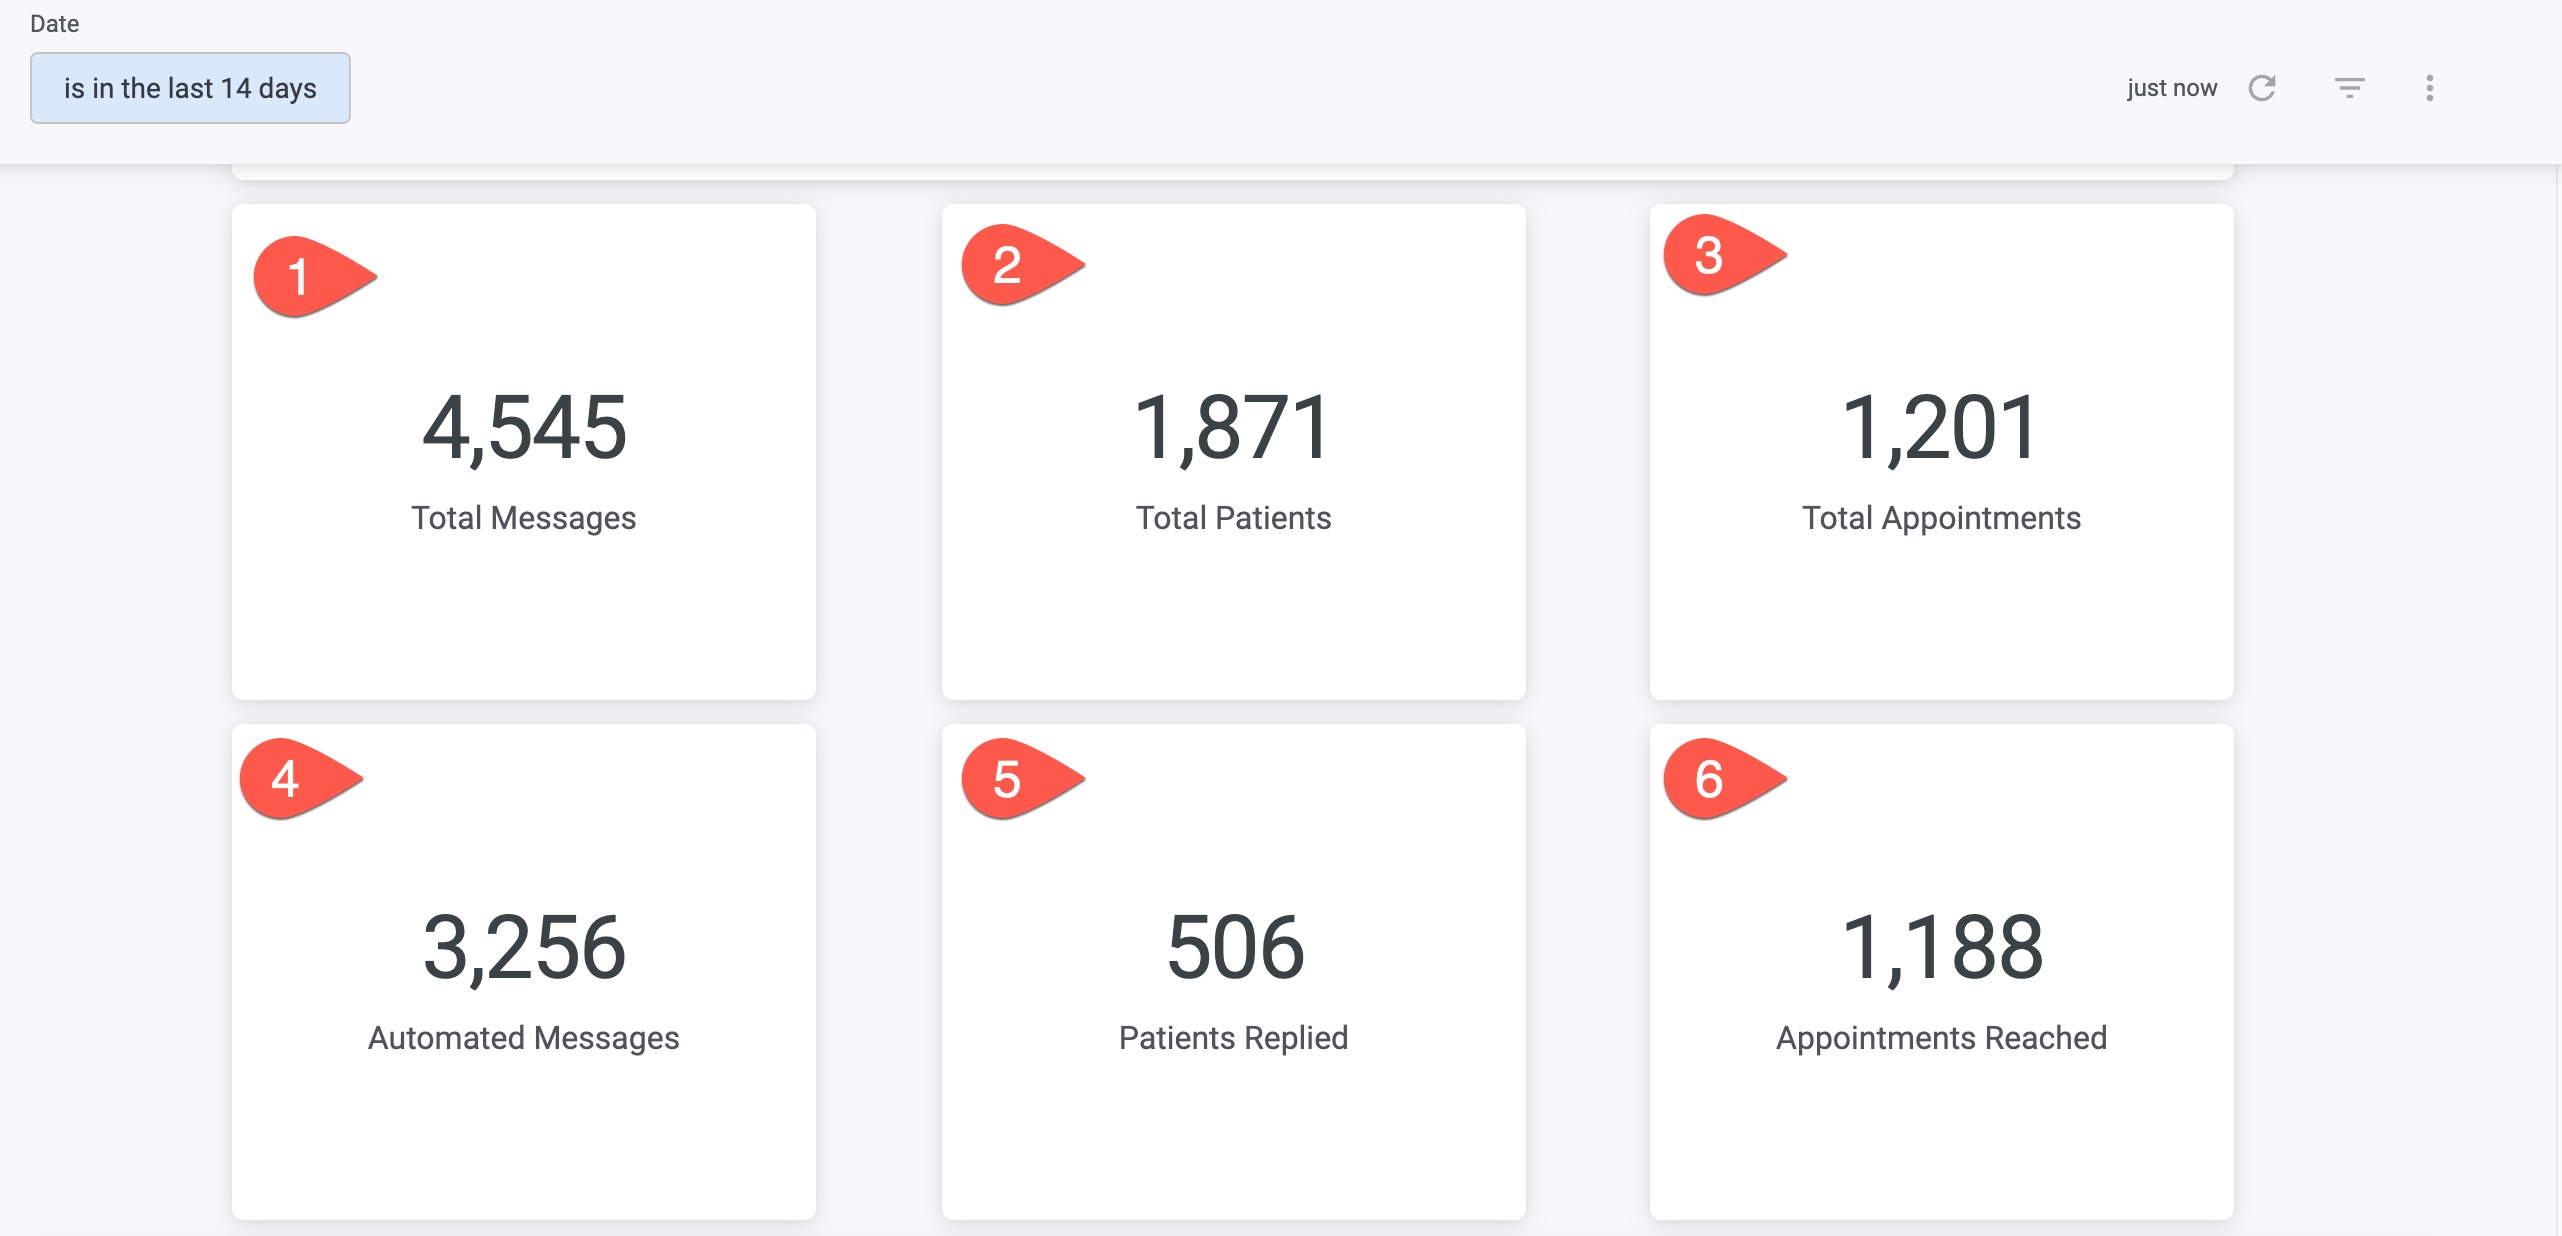
- Total Messages: Total number of messages sent in the specified time frame.
- Total Patients: Total number of patients who have sent/ received a message during the specified time frame.
- Total Appointments: Total number of appointments that flowed into Artera during this period.
- Automated Messages: Total number of automated messages sent in the specified time frame.
- Patients Replied: Total number of patients who replied to any sent message (includes Form responses) during specified time frame.
- Appointments Reached: Total number of appointments that received a message or reminder during specified time frame.
Messaging Analytics
This collection of reports focuses on messaging data.
Patient Response Time (PRT)
Patient Response Time (PRT) measures the time elapsed between when a channel status is set to "Open" and when it changes to "Closed." These metrics track how long patients wait for a response during business hours (as defined in Practice or Line Settings).
Quintiles compare your PRT to all Artera customers. Ranking within the first quintile means that you are in the top 20% of fastest response times - way to go! The second quintile equates to the top 40%, and so on. The smaller the quintile score, the more impressive the Patient Response Time.
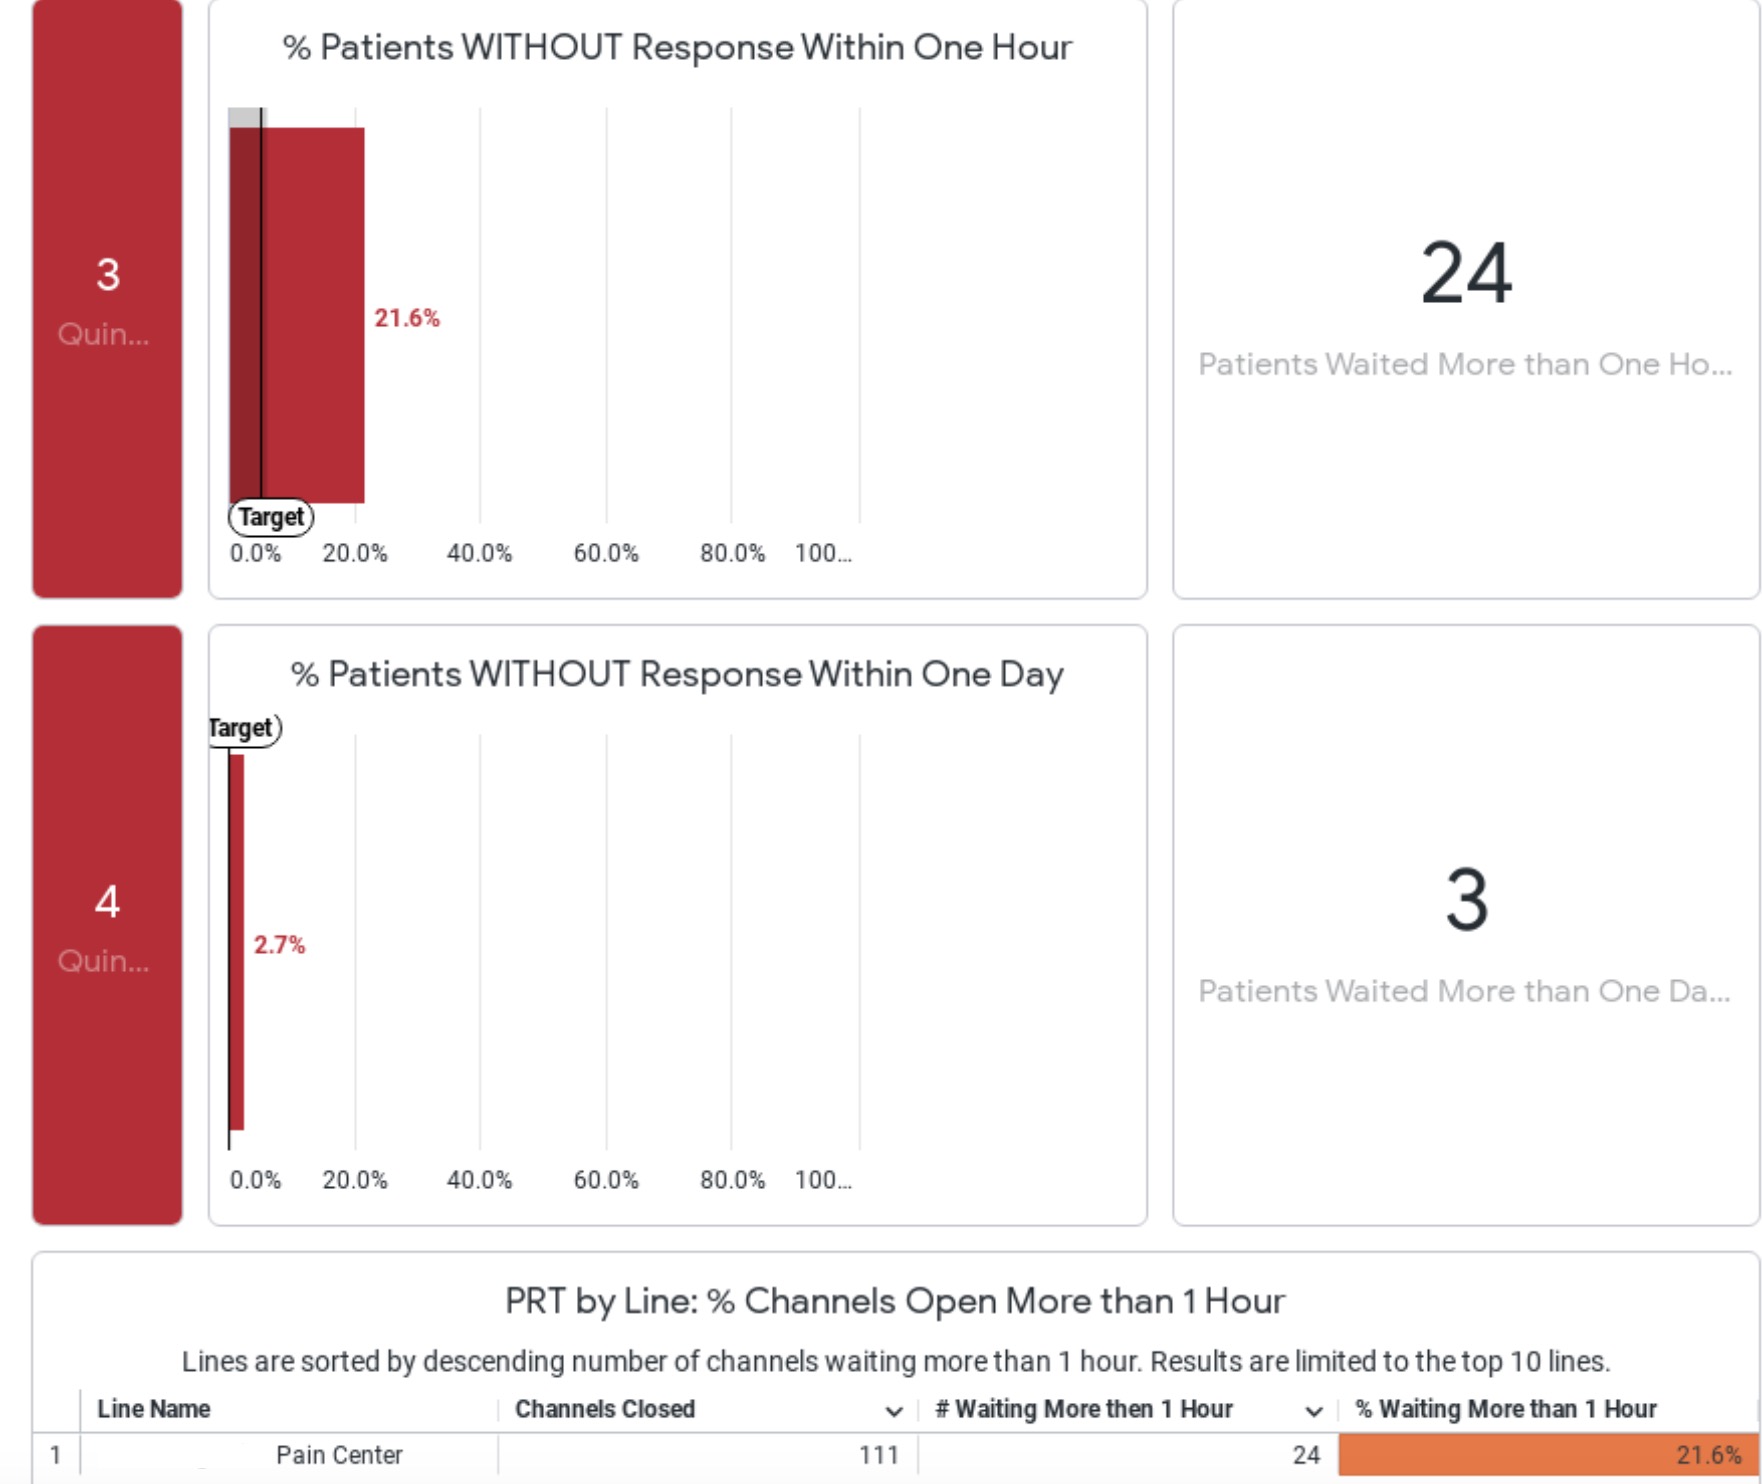
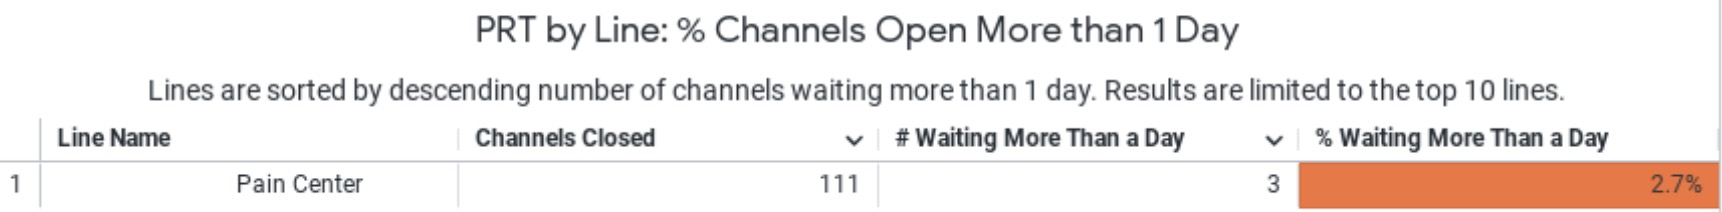
- Patients Without Response Within One Hour: This displays how many Patient Channels took greater than 60 minutes to close. We recommend a goal of 5% or less. If this value is higher than preferred, consider how staff workflows can be improved and which Inbound Keyword Automations can be added to provide patients with instant responses.
- Patients Without Response Within One Day: This displays how many Patient Channels remained open for greater than 8 business hours. We recommend a goal of 0% for this metric. Artera functionality can be leveraged to automate responses where appropriate to keep this value low. If this value is higher than preferred, consider ways to automate workflows using automated messages and evaluating staff processes to explore opportunities for improvement.
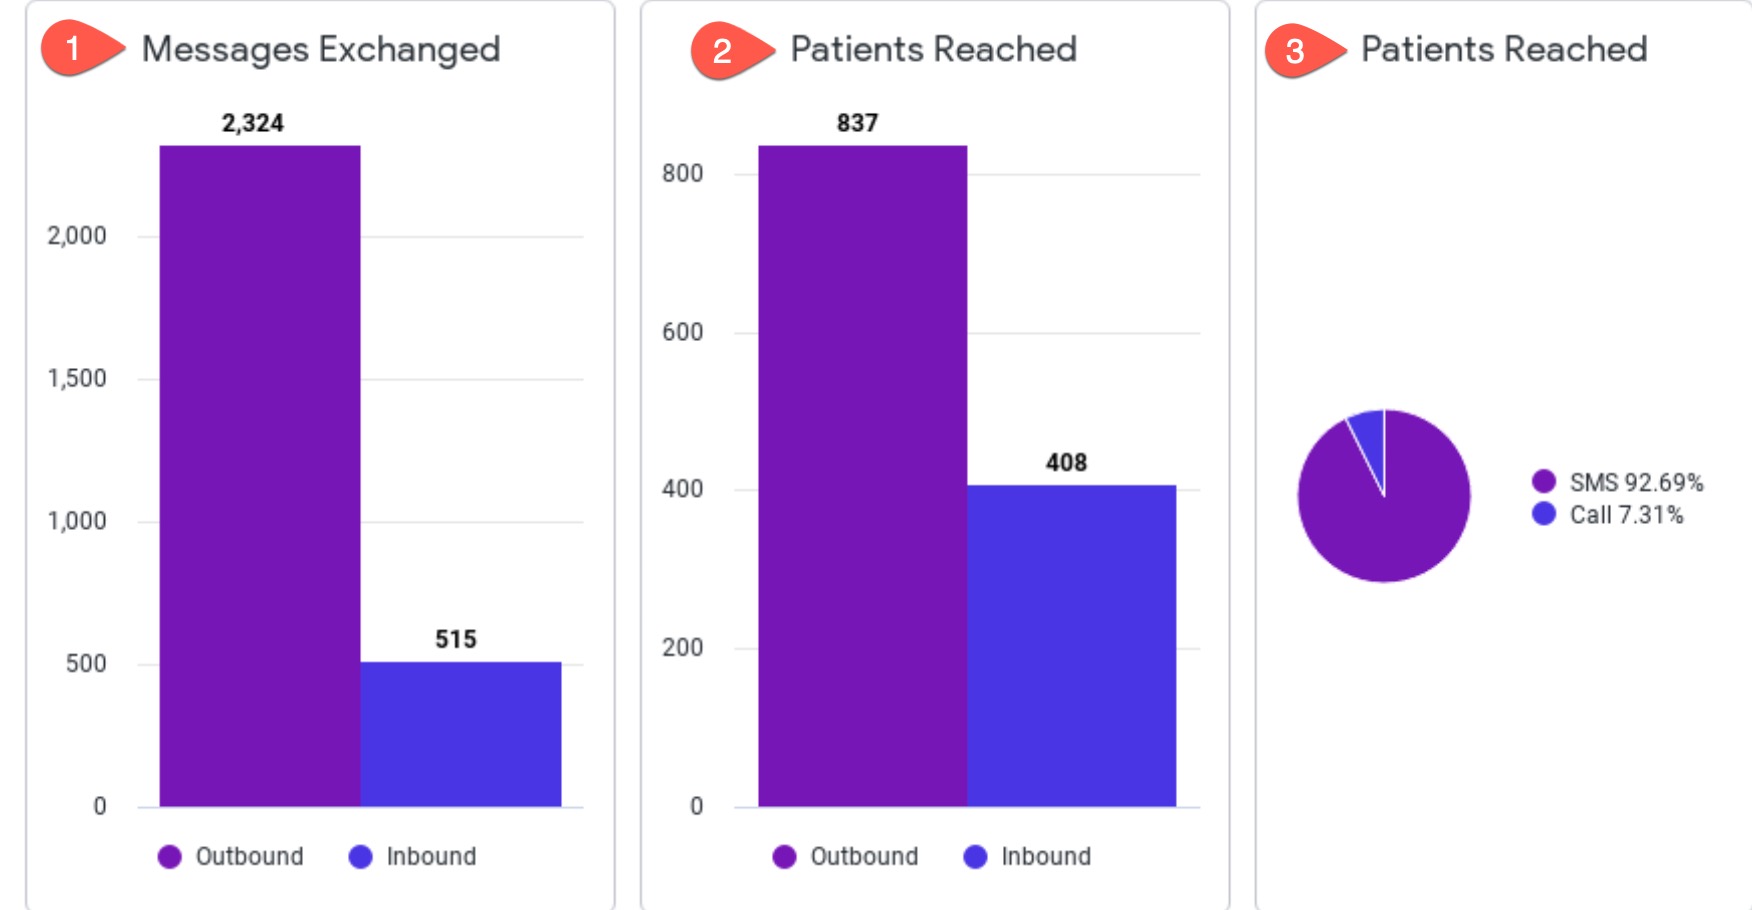
Message and Patient Reach Charts
-
Messages Exchanged
- Outbound: The number of messages sent from Artera
- Inbound: The number of messages received
-
Patients Reached (Bar Graph)
- Outbound: The number of patients who received a message
- Inbound: The number of patients who replied to a message
- Patients Reached (Pie Chart): Messages sent broken down by text, phone, and email
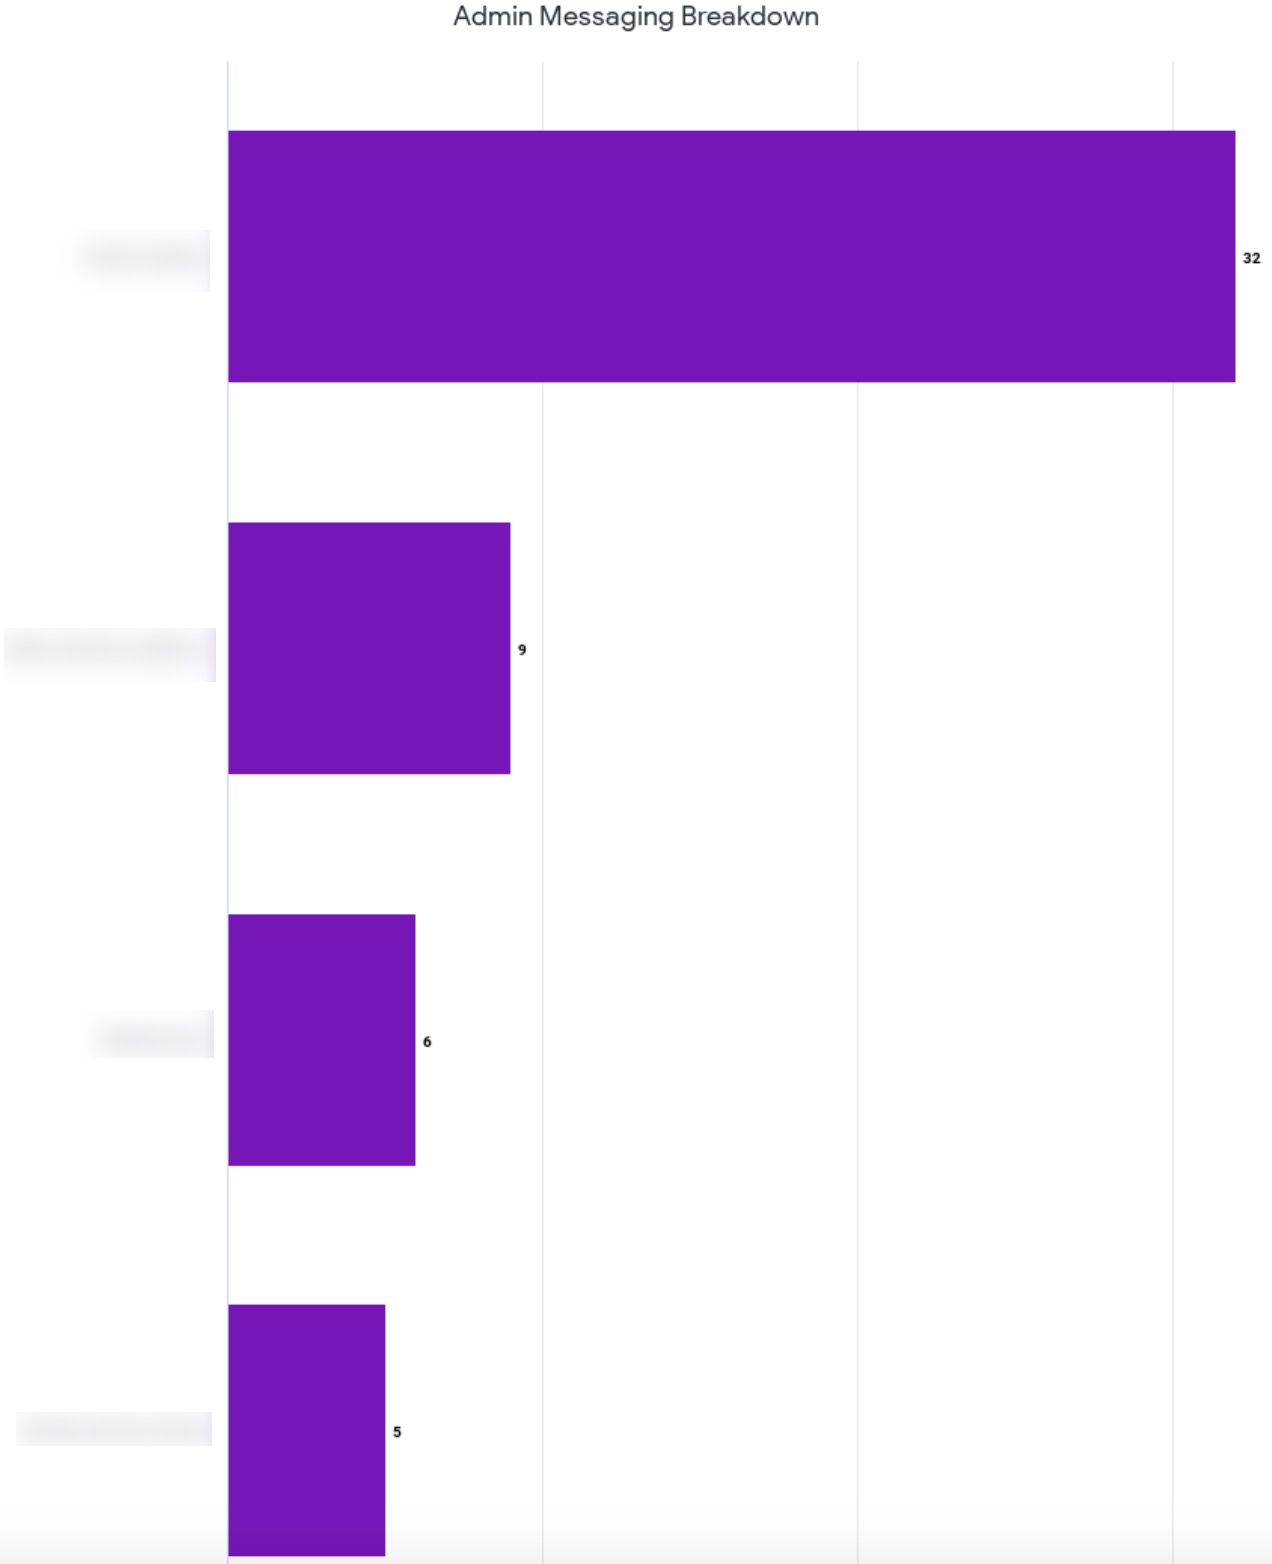
Admin Messaging Breakdown
This chart displays the number of messages sent by Staff users within the Practice.
Appointment Analytics
These reports display Practice data.
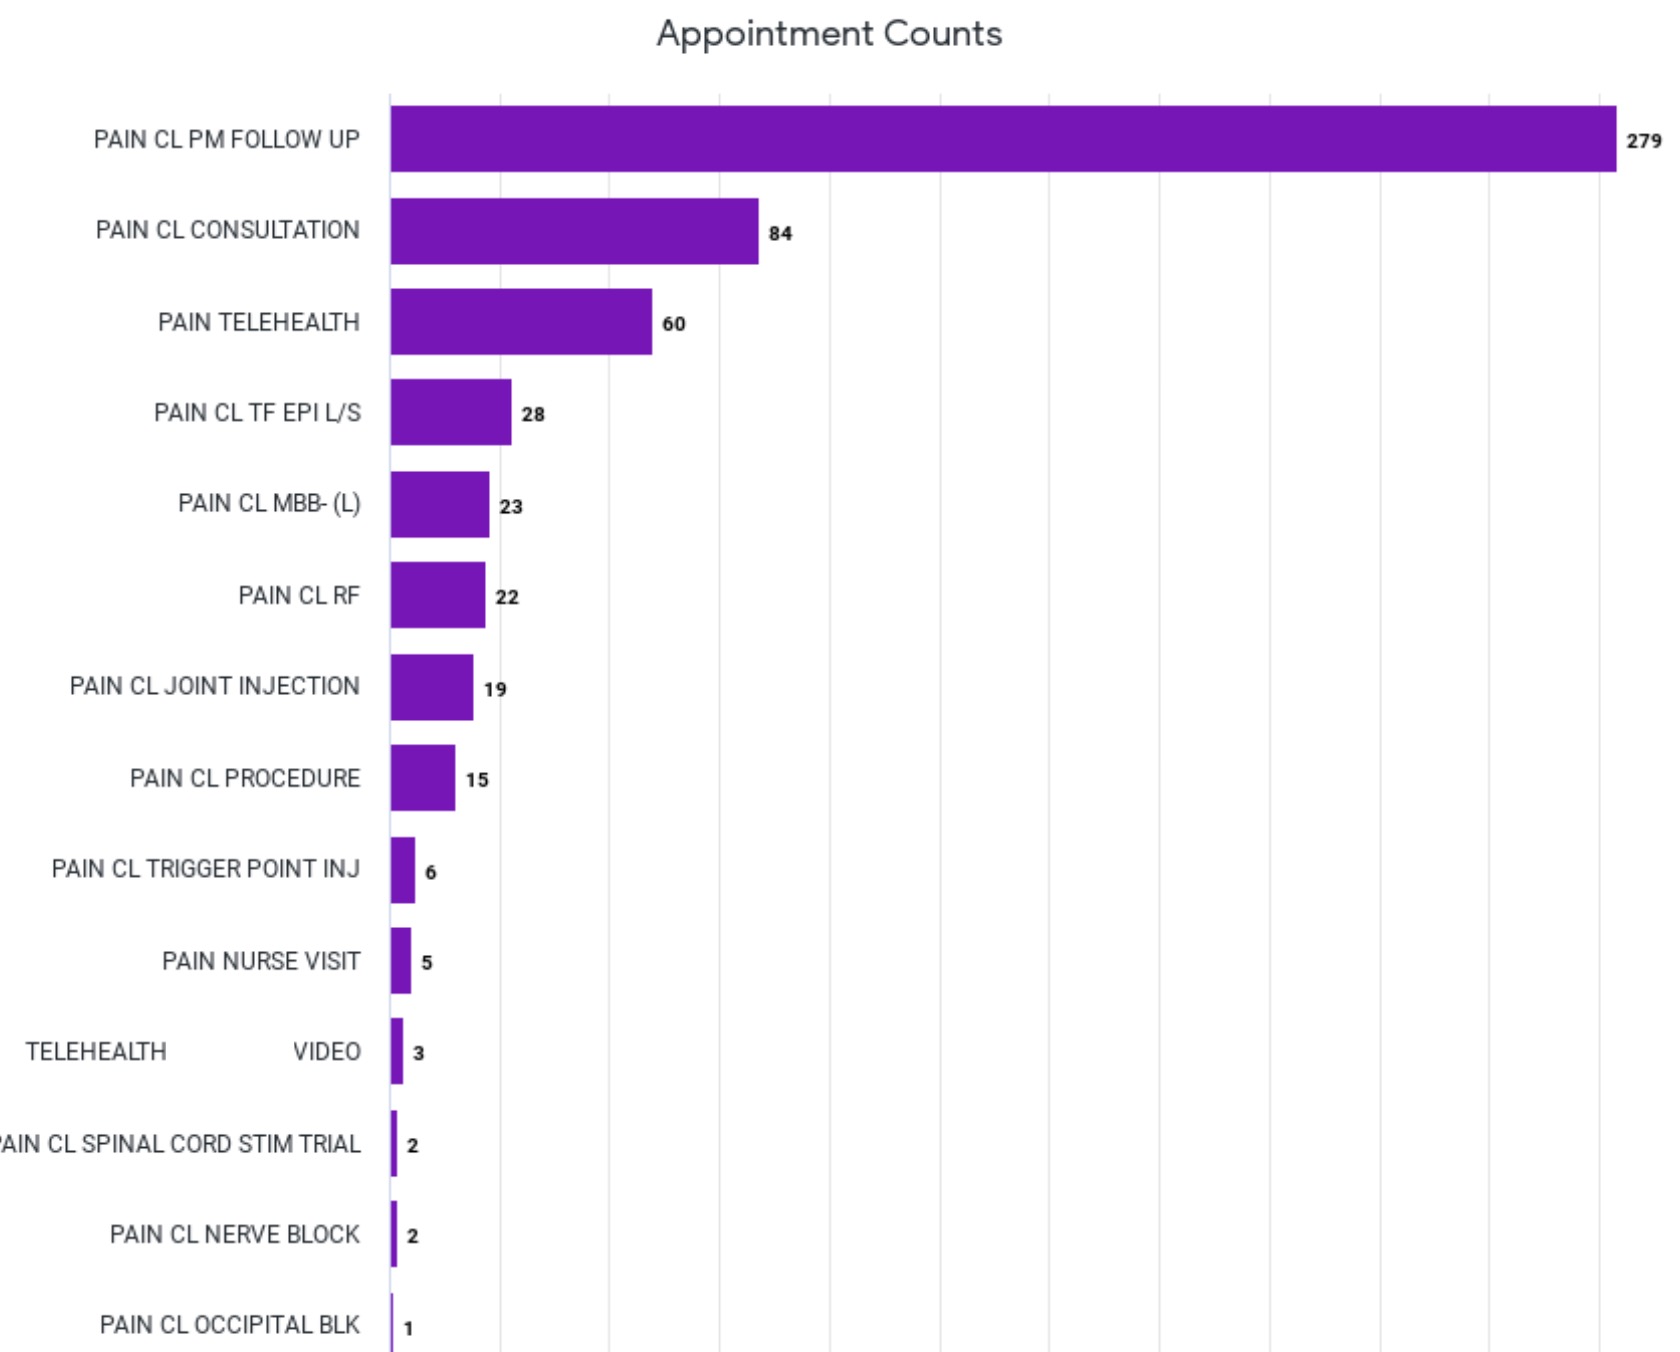
Appointment Counts
The count of appointments by Event Type.
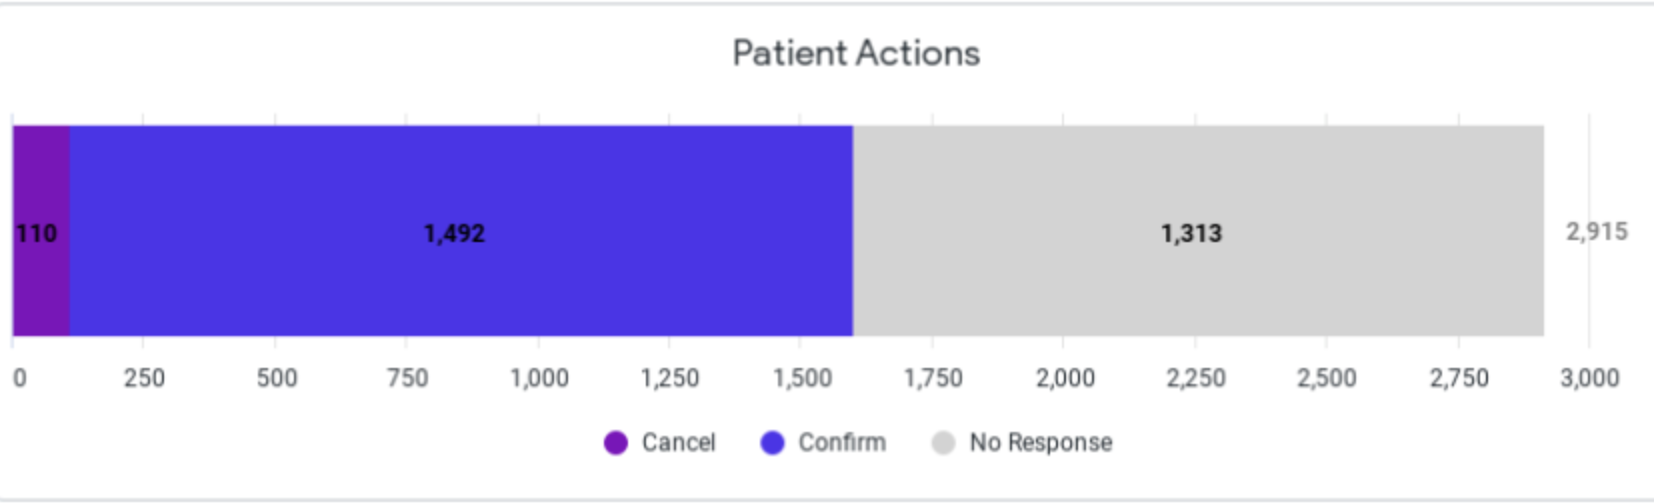
Patient Actions
Breakdown of actions taken by patients on Artera appointment reminders.