Analytics Basic: Enterprise Analytics
- Get Started
- Automations
- Patient Channel
- Patient Facesheet
- Collaborative Inbox
- Lines & Resources Requests
- Lines, Events, Resources
- Analytics
- Platform Settings and Configuration
- Users and Groups
- Campaigns
- SMS Basics
- Troubleshooting and FAQ
- Conversation Builder
- Add-Ons
- Release Notes
- Technical Specifications
- Referrals
- Self-Rescheduling
- Recalls
- Marketplace
- Conversation Manager
Table of Contents
Accessing Enterprise AnalyticsAvailable DashboardsDashboard LayoutDashboard FiltersPatient and Staff Response StatisticsPatient Appointment ResponsesAppointment Reach StatisticsAppointment Reach by PracticeAppointment Reach by EventProduct UsageMessage Usage Over TimeMessage Volume by Type and DestinationDeliverabilityDeliverability of BroadcastsDeliverability of CampaignsUndelivered SMS MessageChatAssist AI UsageAuthentication Timeout MessageExplore key Enterprise metrics that demonstrate the effectiveness of Artera while helping you discover opportunities for improvement. This article discusses the embedded Enterprise Analytics Dashboard, click here to learn about Practice Analytics.
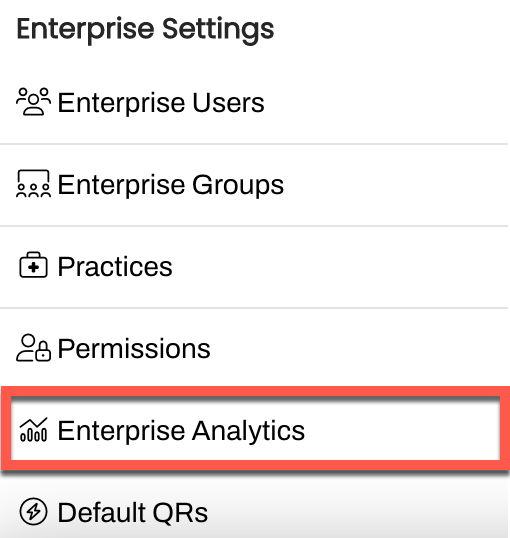
Accessing Enterprise Analytics
Enterprise Users can access Enterprise Analytics from the Enterprise Settings menu:
Available Dashboards
The following Dashboards are designed to provide valuable data insights into your Artera utilization without leaving the platform:
- Patient and Staff Response Statistics
- Appointment Reach Statistics
- Product Usage
- Deliverability
- ChatAssist AI Usage
Dashboard Layout
Each Dashboard begins with key metrics that help you conceptualize your Artera Enterprise's health. Additional supporting visualizations are also provided for detailed investigation and analysis.
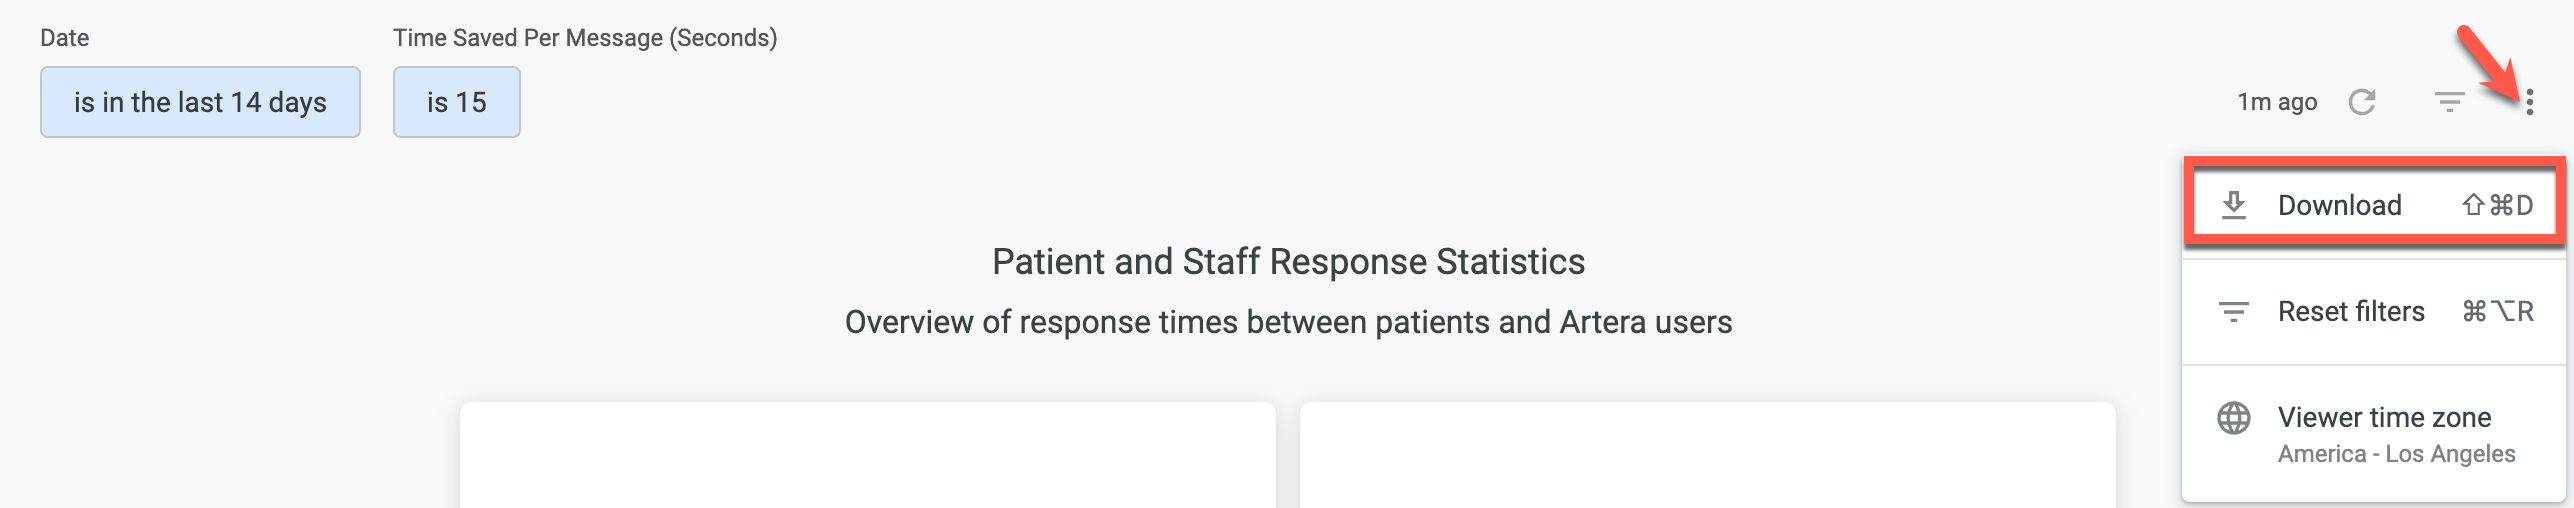
Dashboard Filters
Use the Filters at the top of the Dashboard to set the Date Range and Time Saved Per Message. Time Saved Per Message is used to help calculate efficiency gains. The Time Zone does not display on the physical Dashboard, but the Dashboard is respective of your organization's time zone.

Download
Use the (...) menu to download the data as CSV files for further manipulation or as a PDF.
 Patient and Staff Response Statistics
Update Cadence: Nightly. The Data displayed is from the previous day.
This section provides an overview of response times between patients and Artera users.
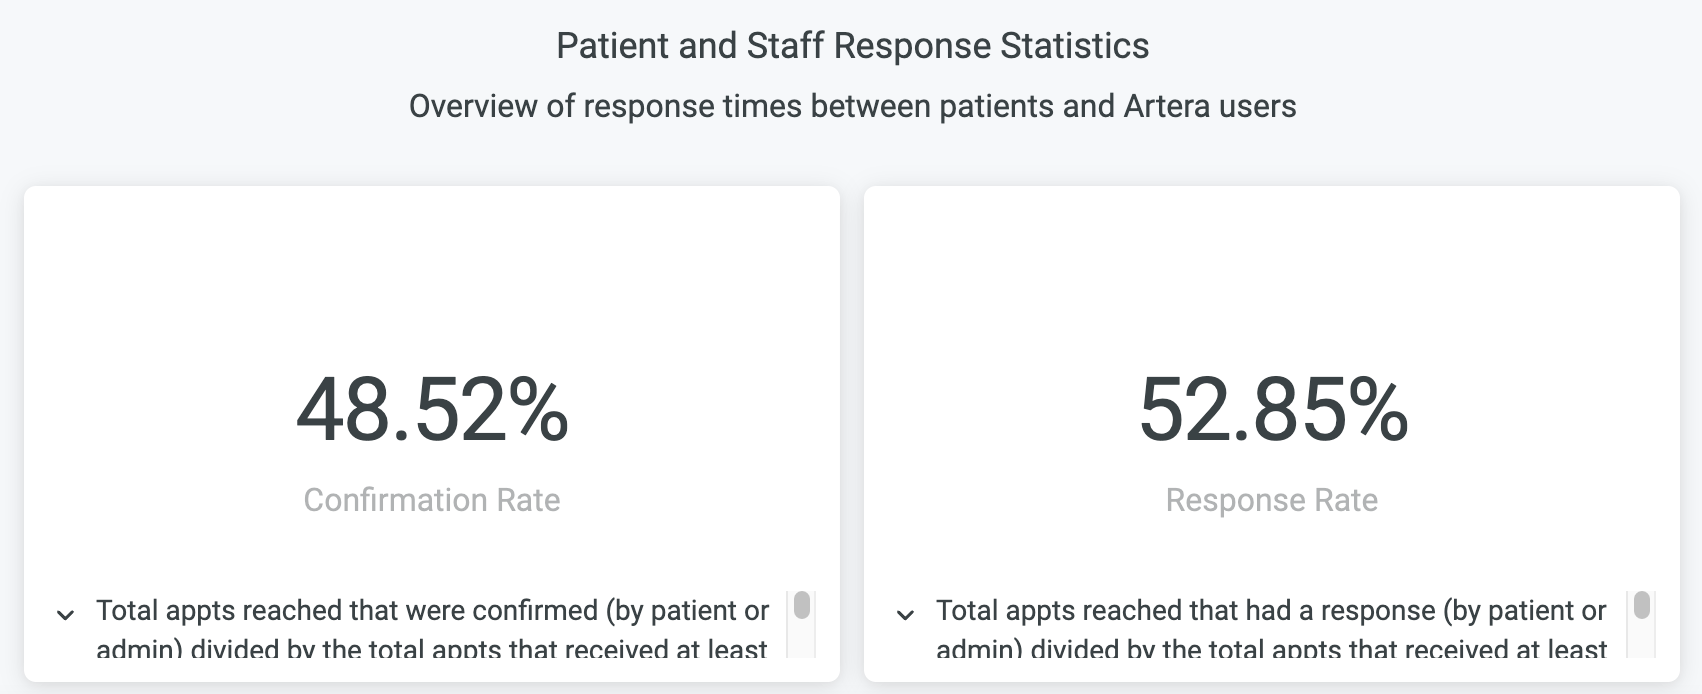
- Confirmation Rate: This rate represents how many patients are responding with a confirmation to your actionable appointment reminders. This provides insight into the efficacy of your appointment confirmation texts.
- Response Rate: This rate indicates how your patients respond to Artera messages. A higher percentage reflects a higher engagement with patients through Artera and your staff.
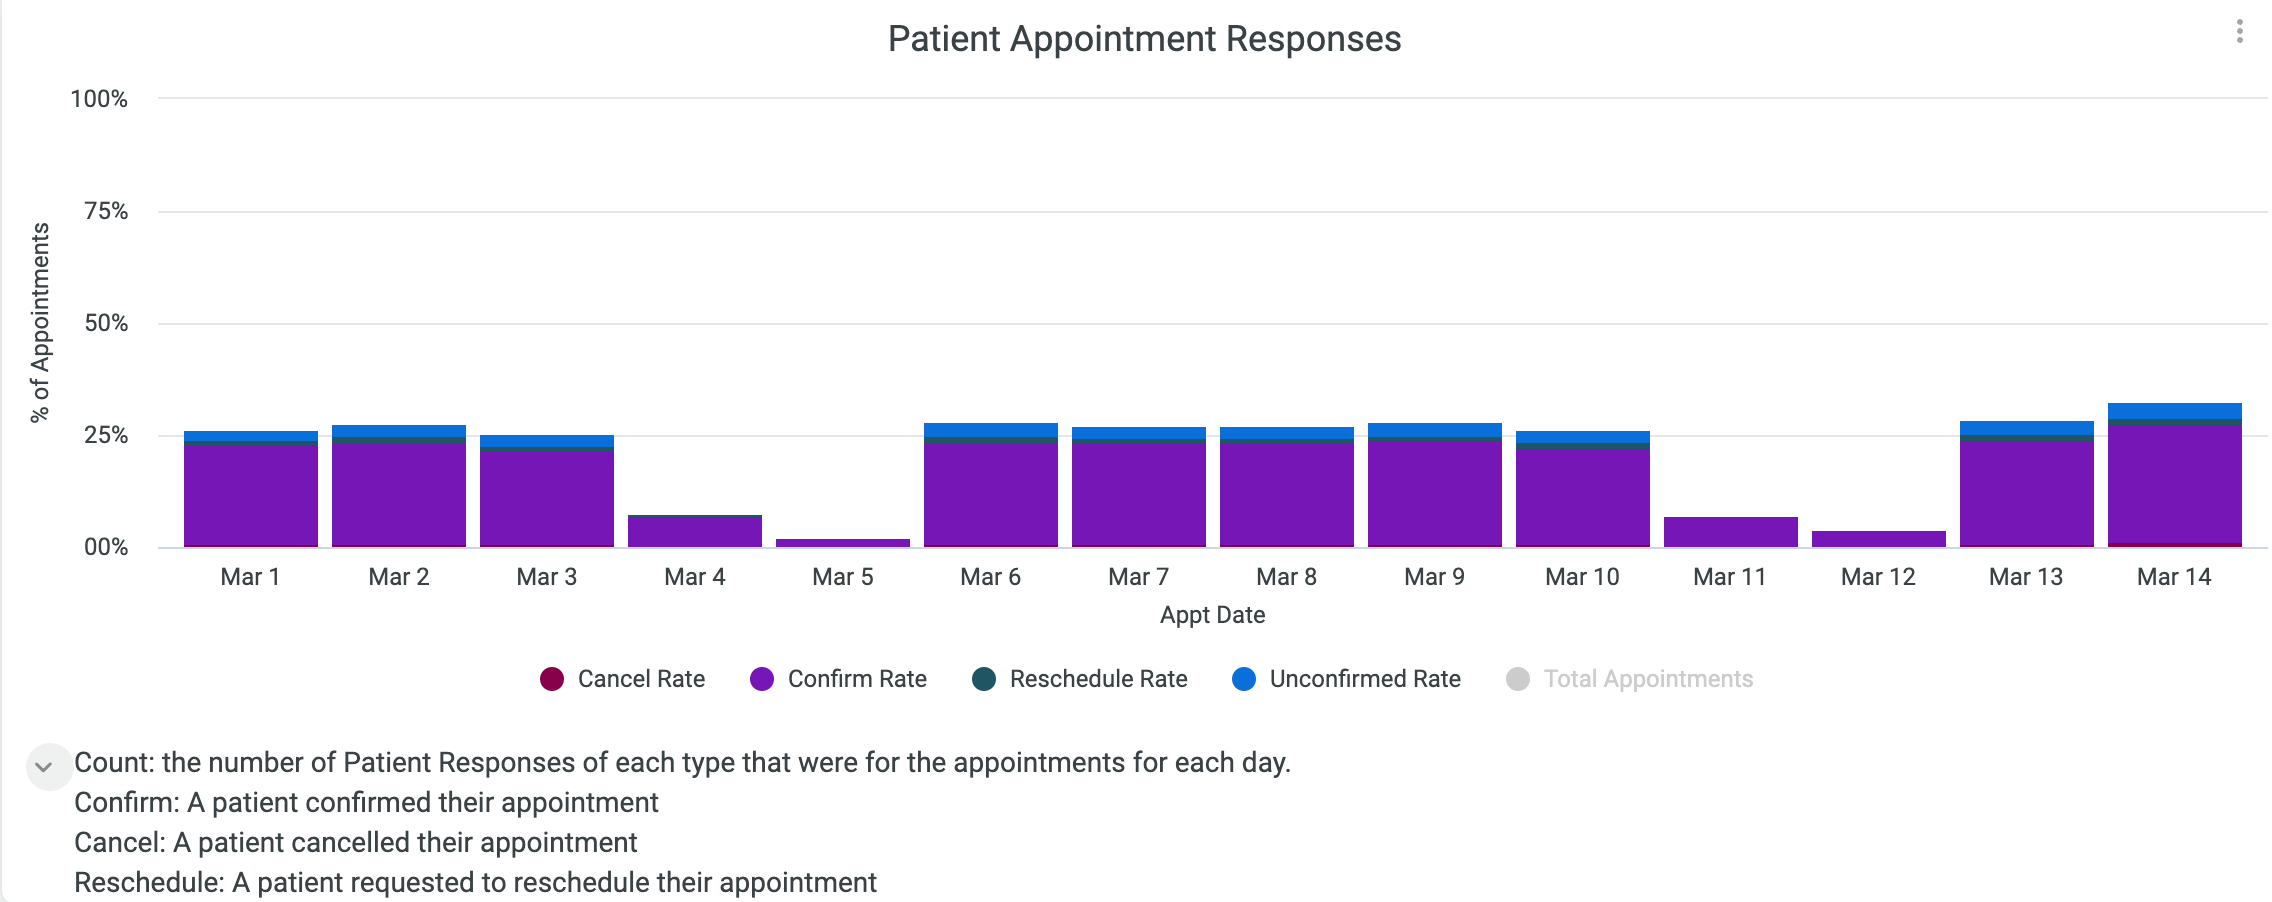
Patient Appointment Responses
The colored bars in this section display a breakdown of responses to appointment confirmation texts for all appointments on that given day. The black dots correspond with the total number of responses to messages containing {eventConfirmText}.
Use this graph to track trends over time and test the effects of changes. Did implementing a new Automation help increase confirmations? Did an external event (e.g. natural disaster) cause a large increase in cancellations or rescheduled appointments?
Patient Response Time (PRT)
Patient Response Time (PRT) measures the time elapsed between when a channel status is set to "Open" and when it changes to "Close." These metrics track how long patients wait for a response during business hours (as defined in Practice or Line Settings).
Quintiles compare your PRT to all Artera customers. Ranking within the first quintile means that you are in the top 20% of fastest response times - way to go! The second quintile equates to the top 40%, and so on. The smaller the quintile score, the more impressive the Patient Response Time.
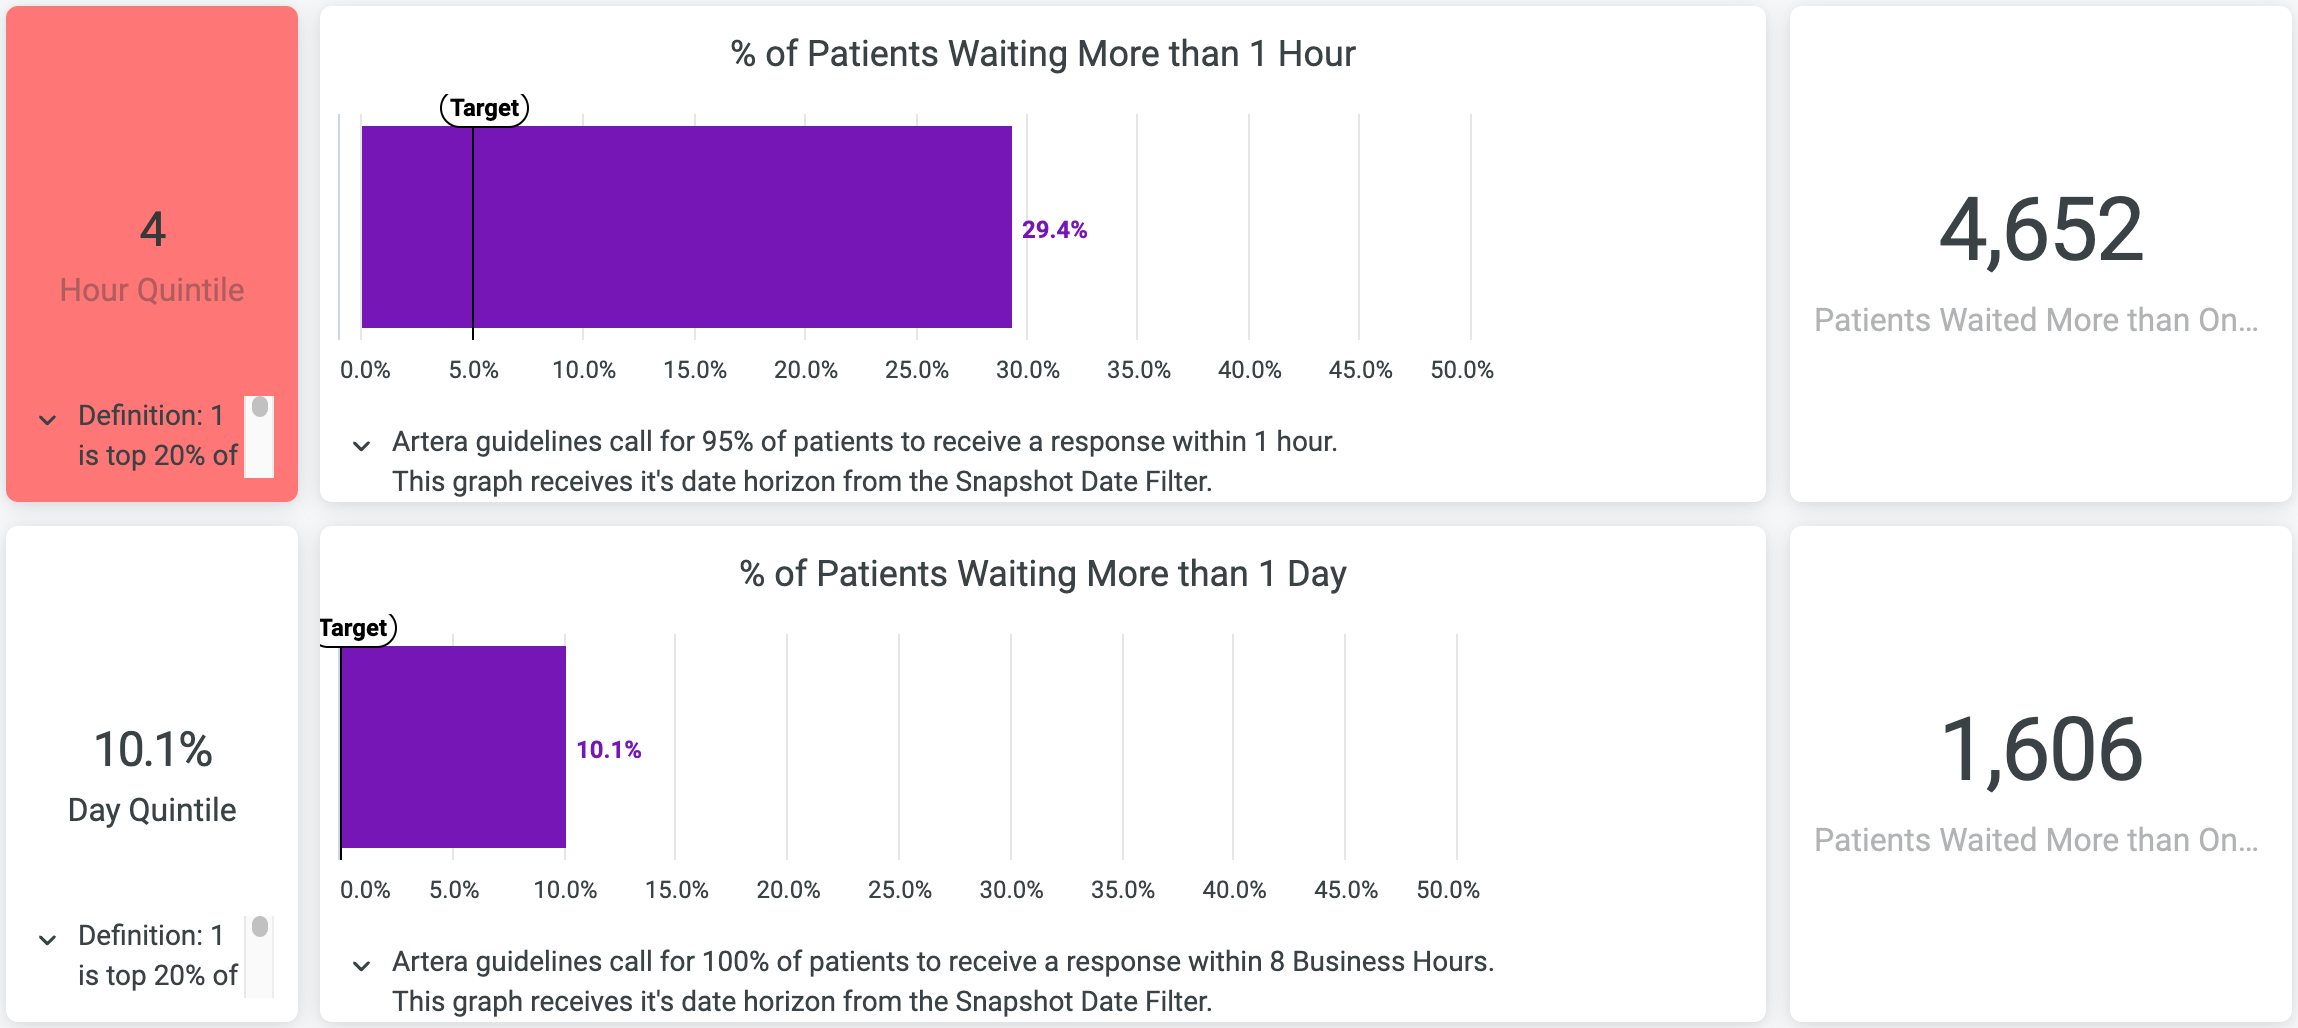
- Patients Waiting More Than One Hour: This shows how many Patient Channels took more than 60 minutes to close. We recommend a goal of 5% or less. If this value is higher than preferred, consider how staff workflows can be improved and what inbound keyword automations can be added to give instant responses.
- Patients Waiting More Than One Day: This shows how many Patient Channels were open for more than 8 business hours. We recommend a goal of 0% for this metric. Artera functionality can be leveraged to automate responses where appropriate to keep this value low. If this value is higher than preferred, consider ways to automate workflows using automated messages and evaluating staff processes to explore opportunities for improvement.
Appointment Reach Statistics
Update Cadence: Nightly. The data displayed is from the previous day.
This section provides a breakdown of appointments with related Automations.
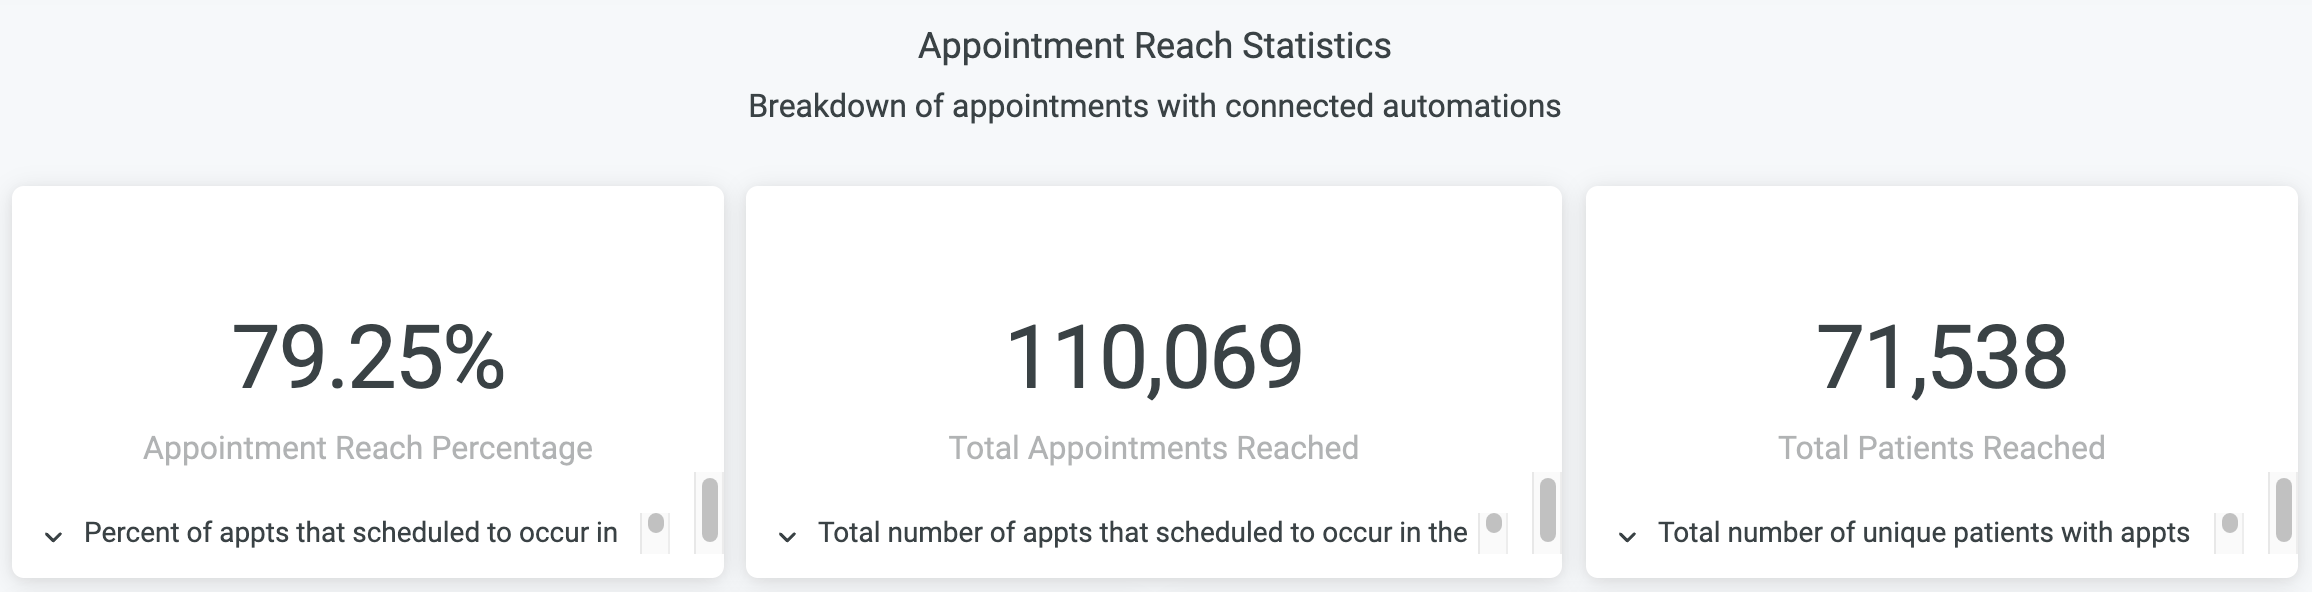
- Appointment Reach Percentage: This value is a measure of how many scheduled appointments receive at least one automated message. We recommend maximizing this number. If it seems low, dig into the appointment reach by event to see which events could benefit from automations.
- Total Appointments Reached: The count of appointments that received at least scheduled to occur in the past month that received at least one automated message. This number is a quick snapshot of the total volume of appointments in your system that trigger at least one message through Artera.
- Total Patients Reached: This is the total number of unique patients with appointments that were scheduled to occur in the past month that received at least one automated message.
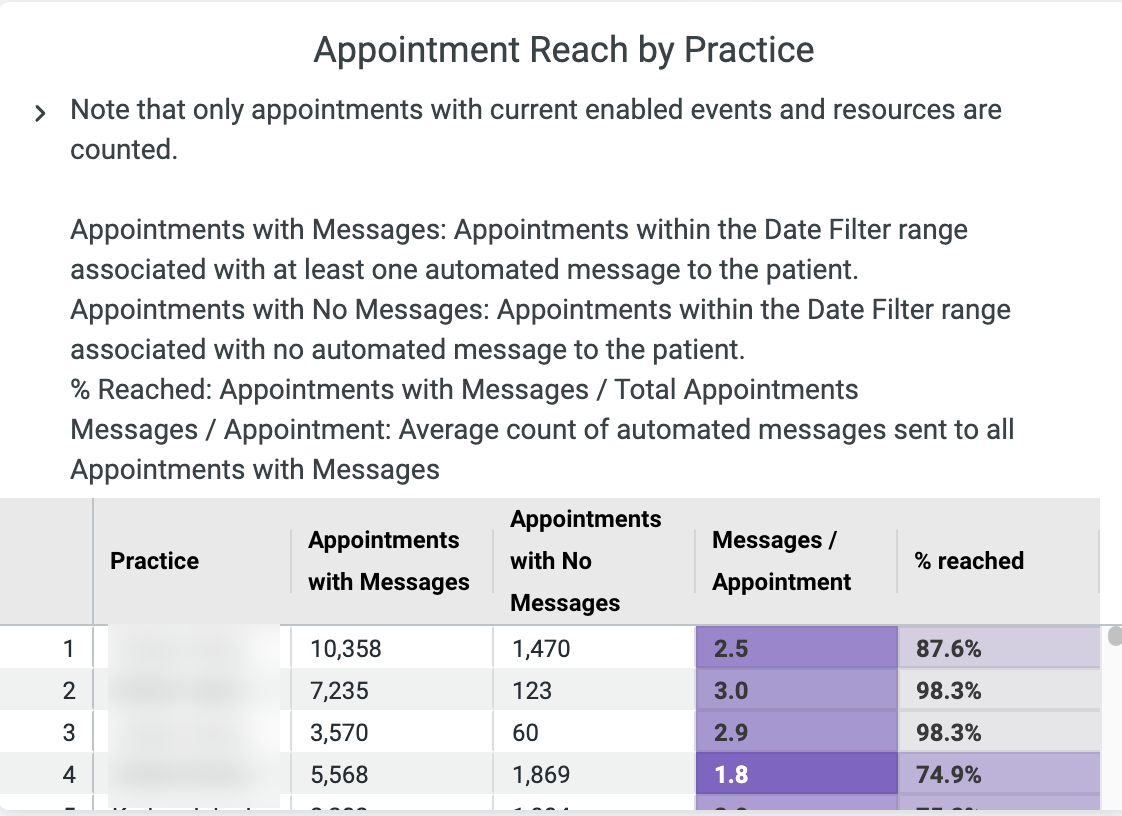
Appointment Reach by Practice
This section breaks down the Appointment Reach Percentage for each individual Practice. Use this data to identify which Practices are most successful utilizing Artera to engage patients, as well as identifying which Practices have opportunities for growth.
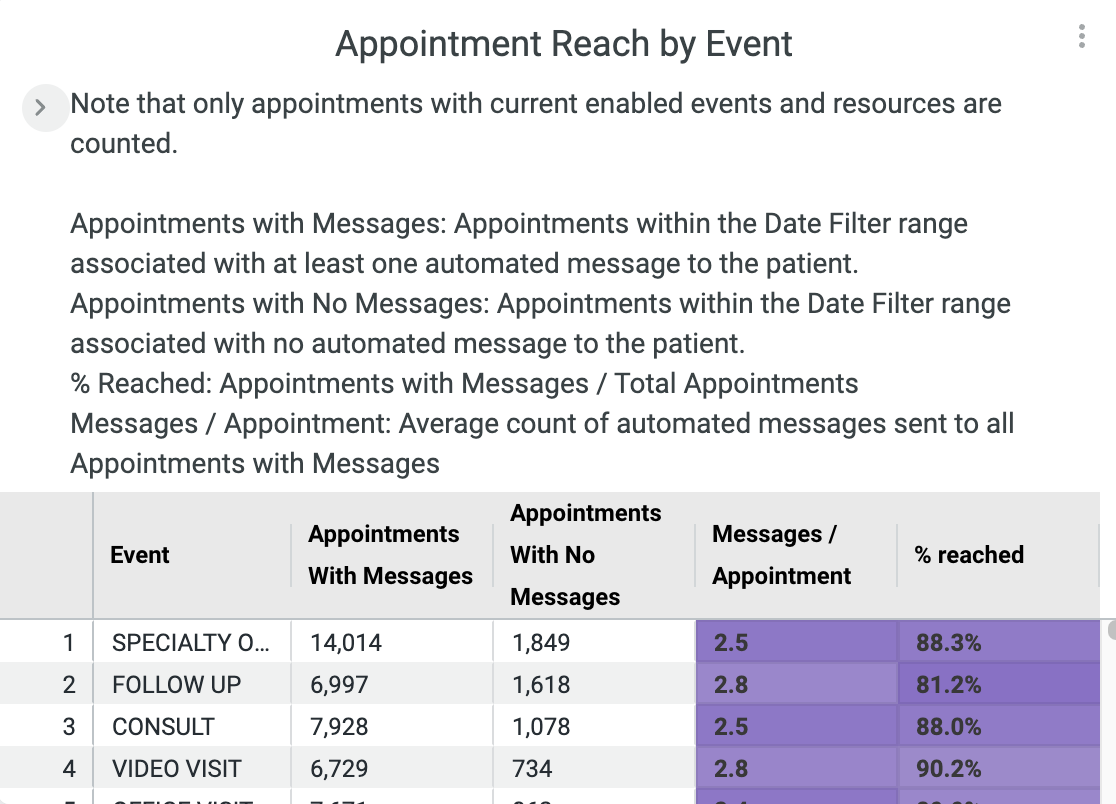
Appointment Reach by Event
This section breaks down the Appointment Reach Percentage for each Event Type used in Artera. Events with lower rates should have new or updated Automations associated with them to increase engagement with patients, as well as finding the "sweet spot" for the number of Automations associated with an Event Type.
 Product Usage
Update Cadence: Nightly. The data displayed is from the previous day.
This section is an overview of how Artera is being used by patients and providers.
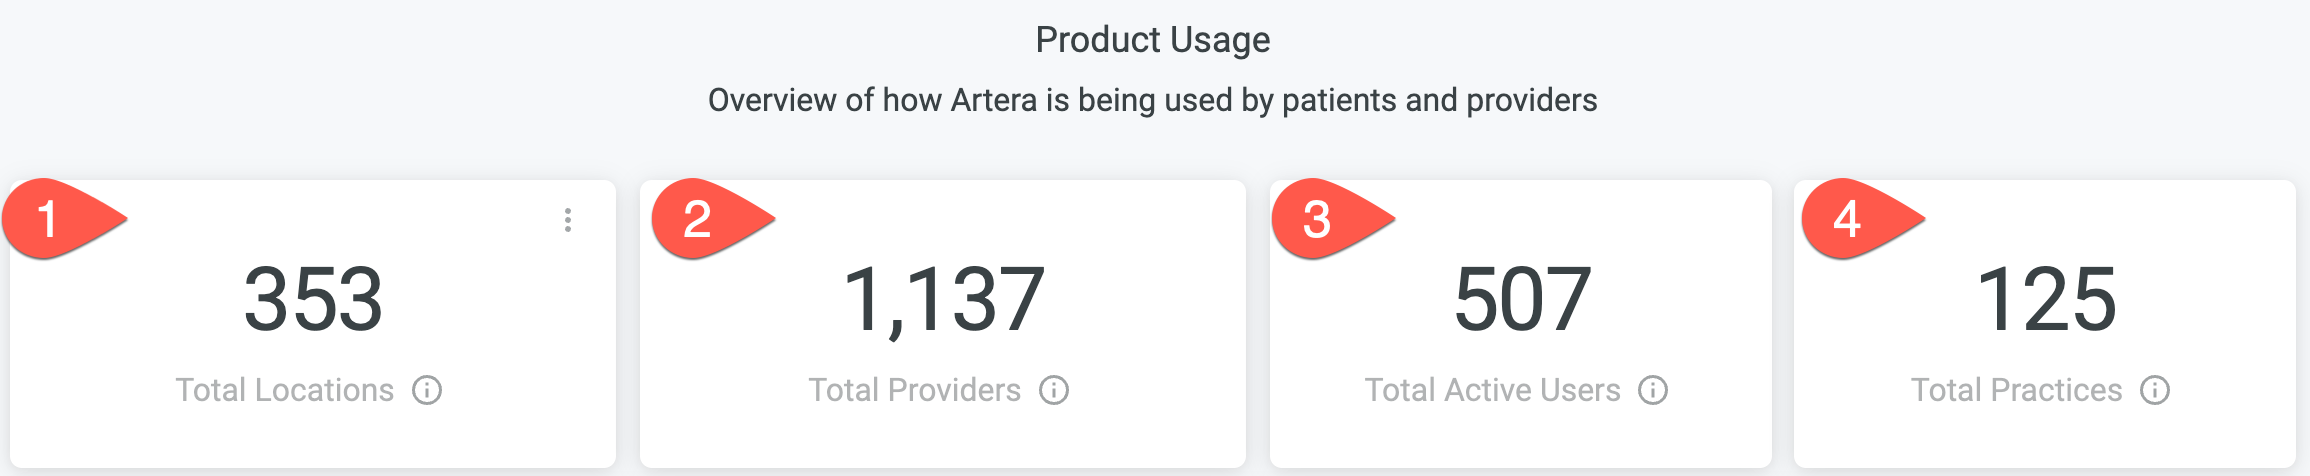
- Total Locations: The total number of locations stored in Artera for your Enterprise.
- Total Providers: The total number of providers whose appointments were reached through Artera.
- Total Active Users: This is the total number of users within the platform that have sent at least one message (SMS, call, or email via manual or broadcast) to a patient in the past month. This reflects how many staff members are utilizing Artera to connect with patients.
- Total Practices: This is the total number of Practices whose appointments were reached through Artera. The meaning of this number varies greatly across Artera's various health systems, though is a useful metric for Artera Support to understand how Practices are set up within your health system.
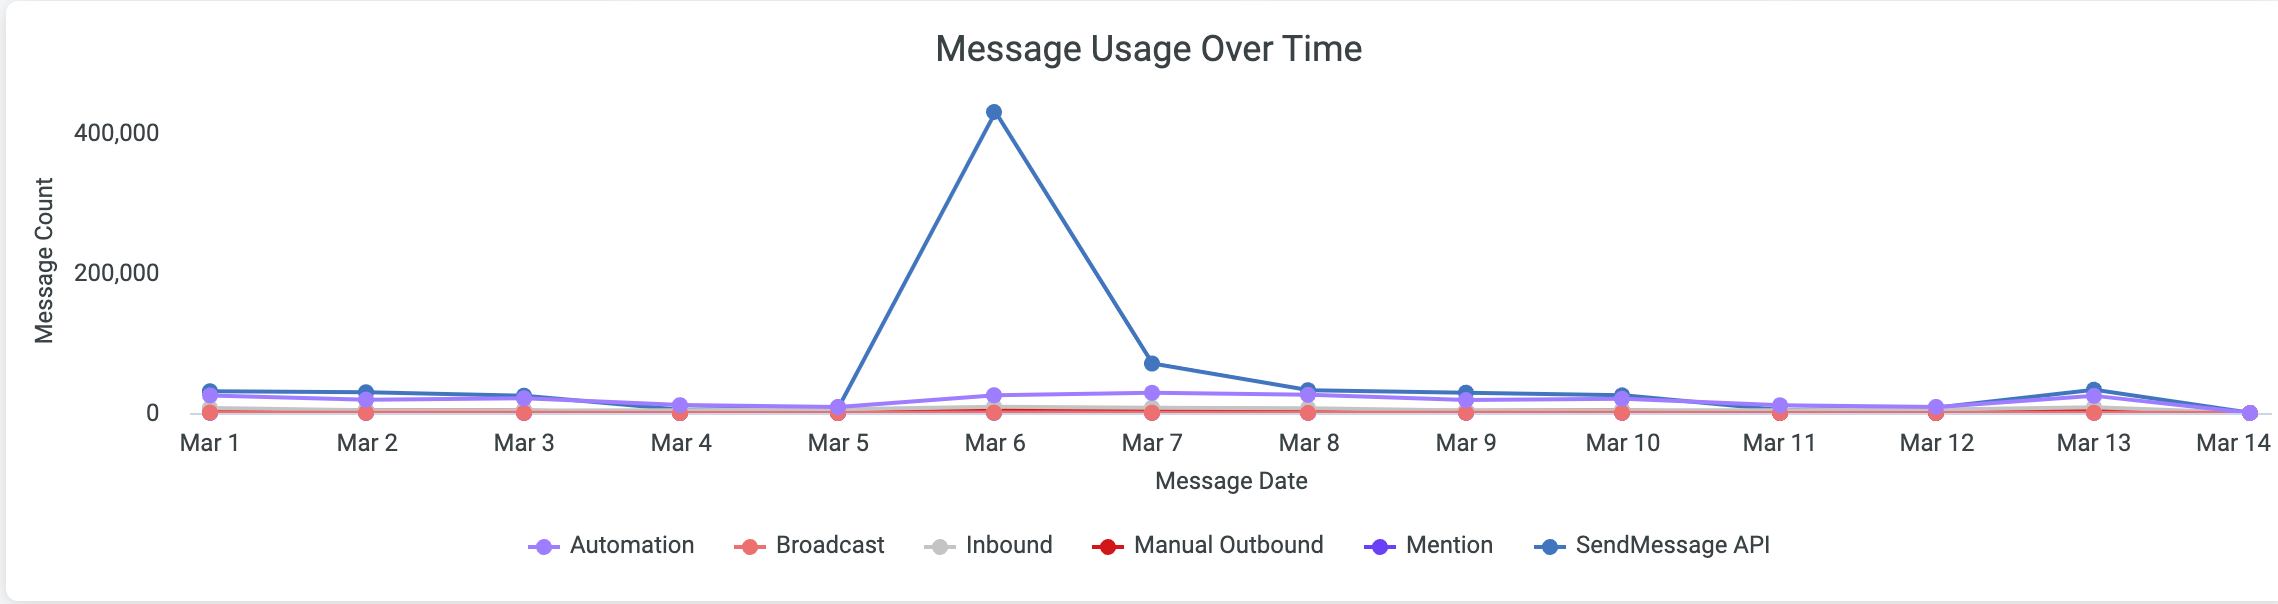
Message Usage Over Time
This is a breakdown of how many messages were sent by type over time. It helps demonstrate how your team uses the Artera platform.
Message Volume by Type and Destination
This table provides a detailed view of how your team uses Artera to communicate with patients.
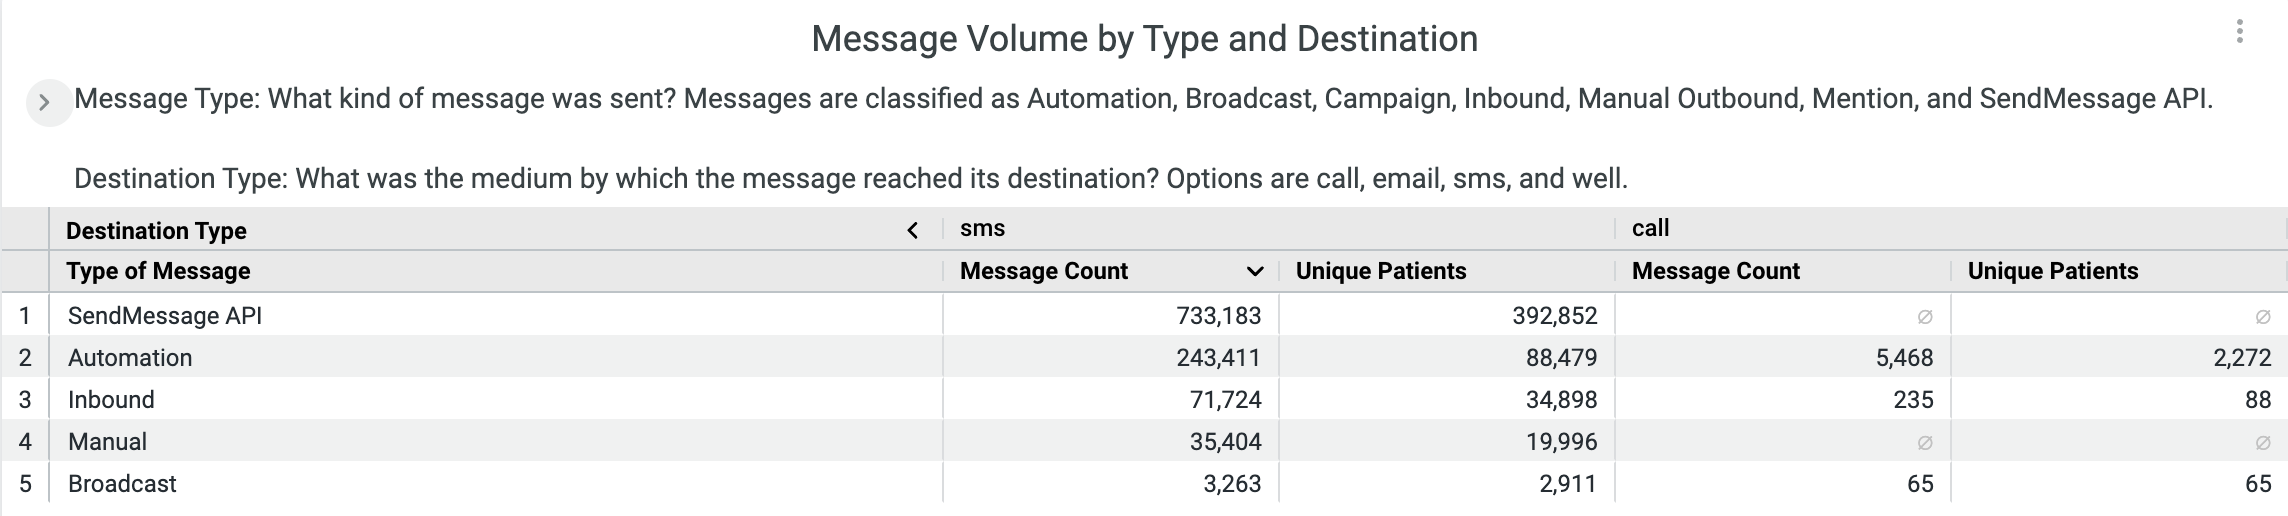
-
Message Type: Defines the type of message sent using the following classifications. Click here for descriptions on each Message Type:
Automation
Broadcast
Campaign
Inbound
Manual Outbound
Mention
SendMessage API
-
Destination Type: Defines the medium by which a message reached its destination using the following classifications:
Call
Email
SMS
Artera
Deliverability
Update Cadence: Nightly. The data displayed is from the previous day.
This section provides insight into how often your messages are delivered.
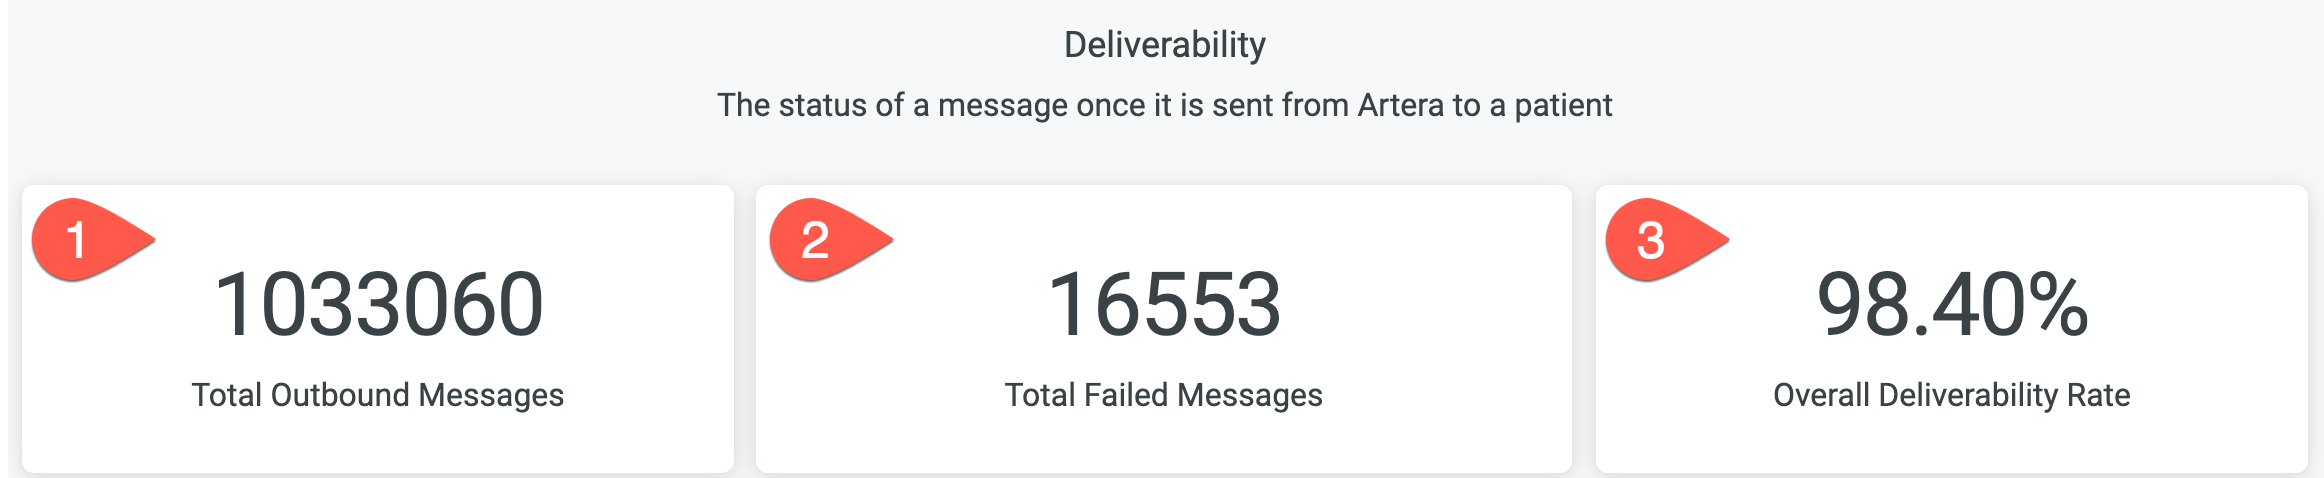
- Total Outbound Messages: Total count of messages sent from Artera during the selected date range.
- Total Failed Messages: The total number of failed messages sent from Artera during the selected date range.
- Overall Deliverability Rate: The percent of Outbound Messages that were successfully delivered.
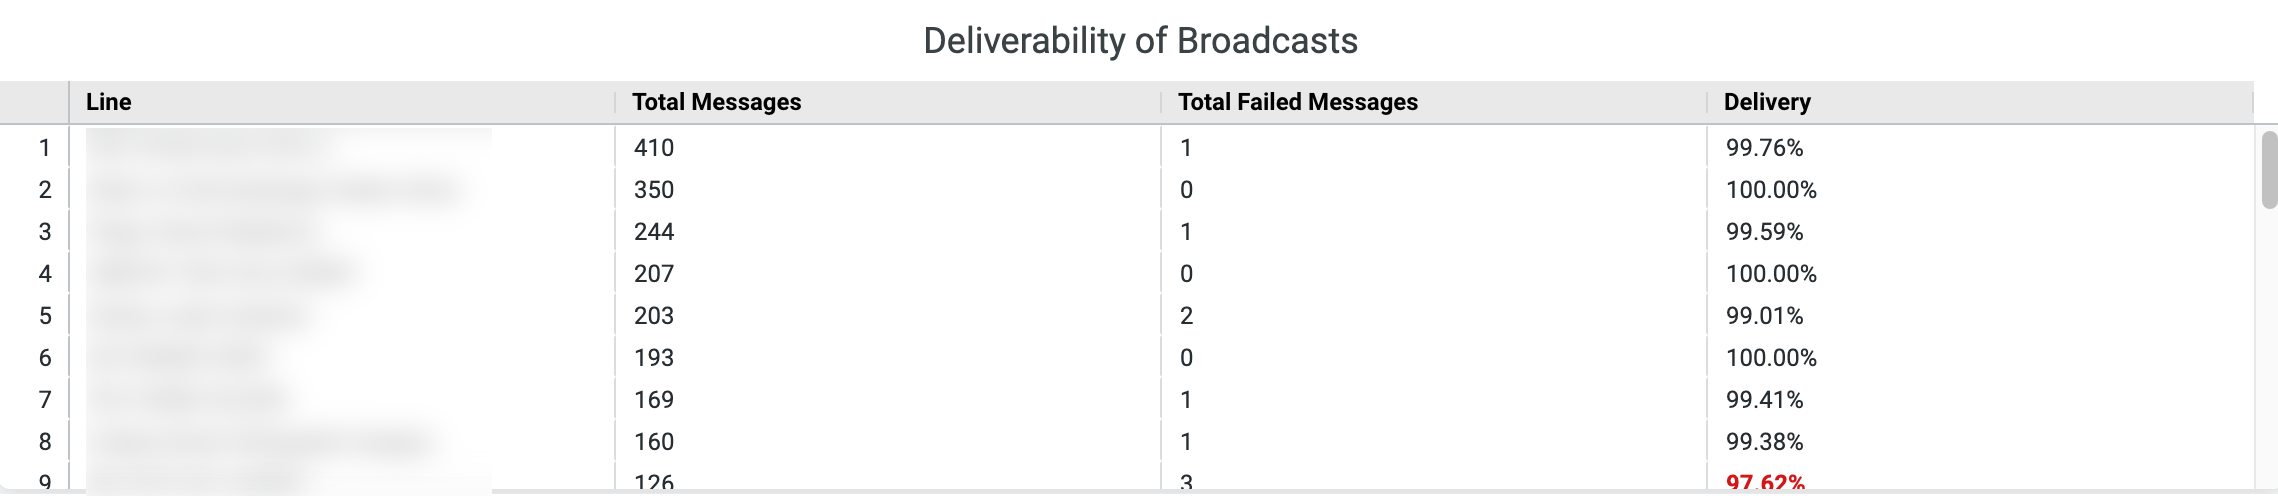
Deliverability of Broadcasts
This table displays the deliverability of Broadcast messages by Line. We recommend all Broadcasts have a delivery rate of 97% or more.
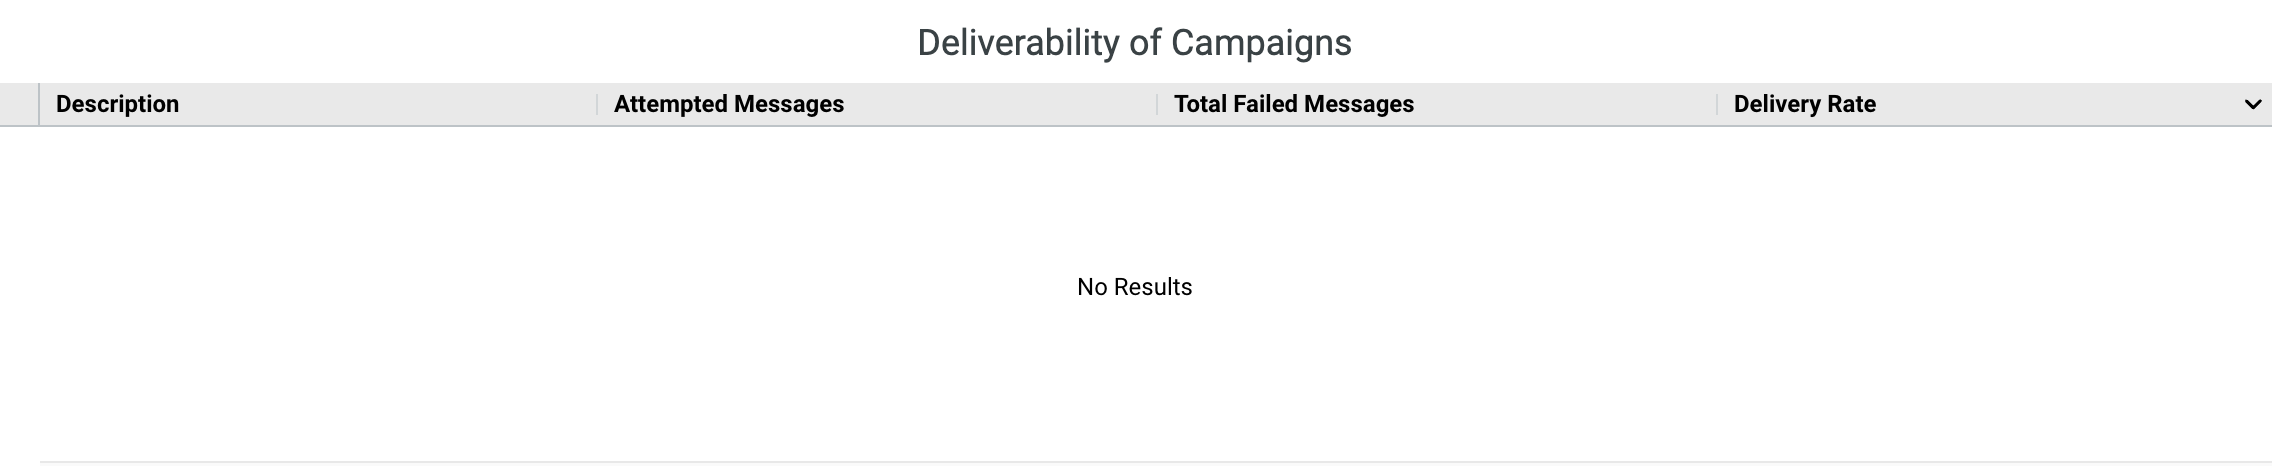
Deliverability of Campaigns
This table displays the delivery of Campaigns by Campaign Description.
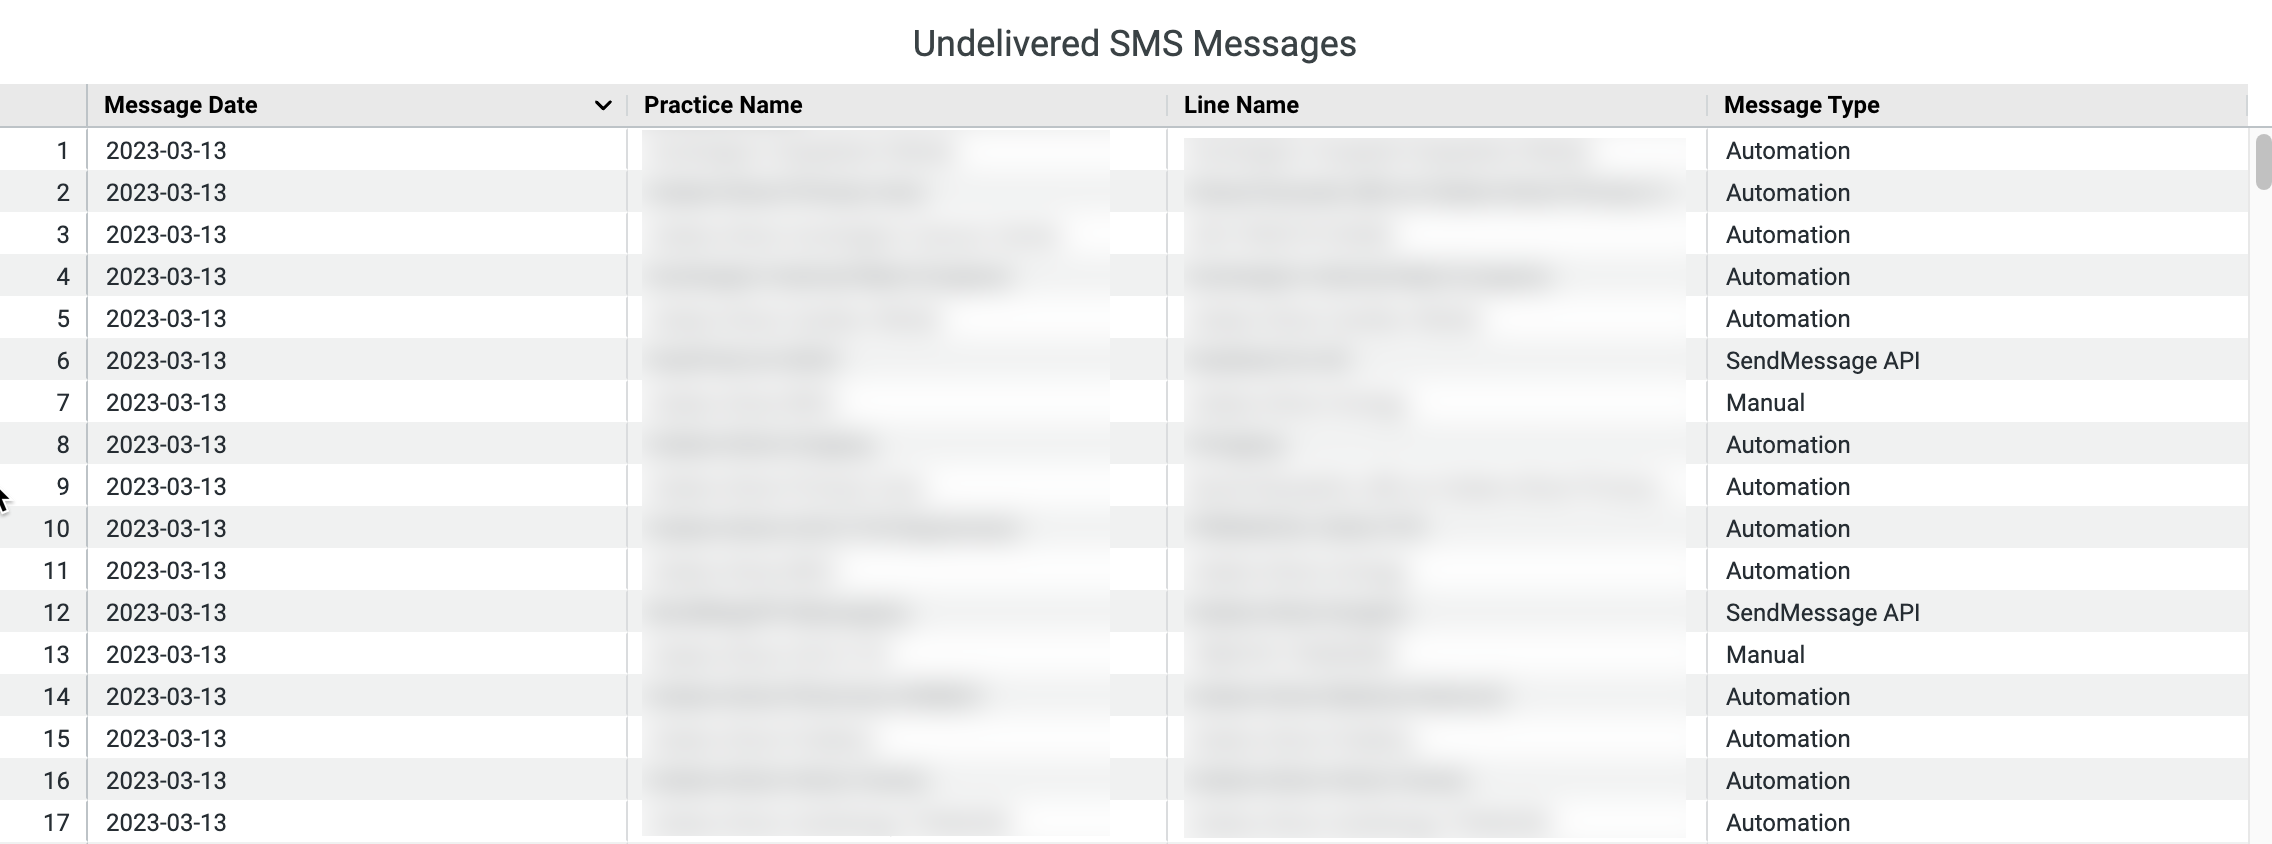
Undelivered SMS Message
This table displays a list of failed SMS Messages.
 ChatAssist AI Usage
Update Cadence: Nightly. The data displayed is from the previous day.
Measure the effectiveness of ChatAssist AI conversations from your Enterprise Analytics Dashboard.
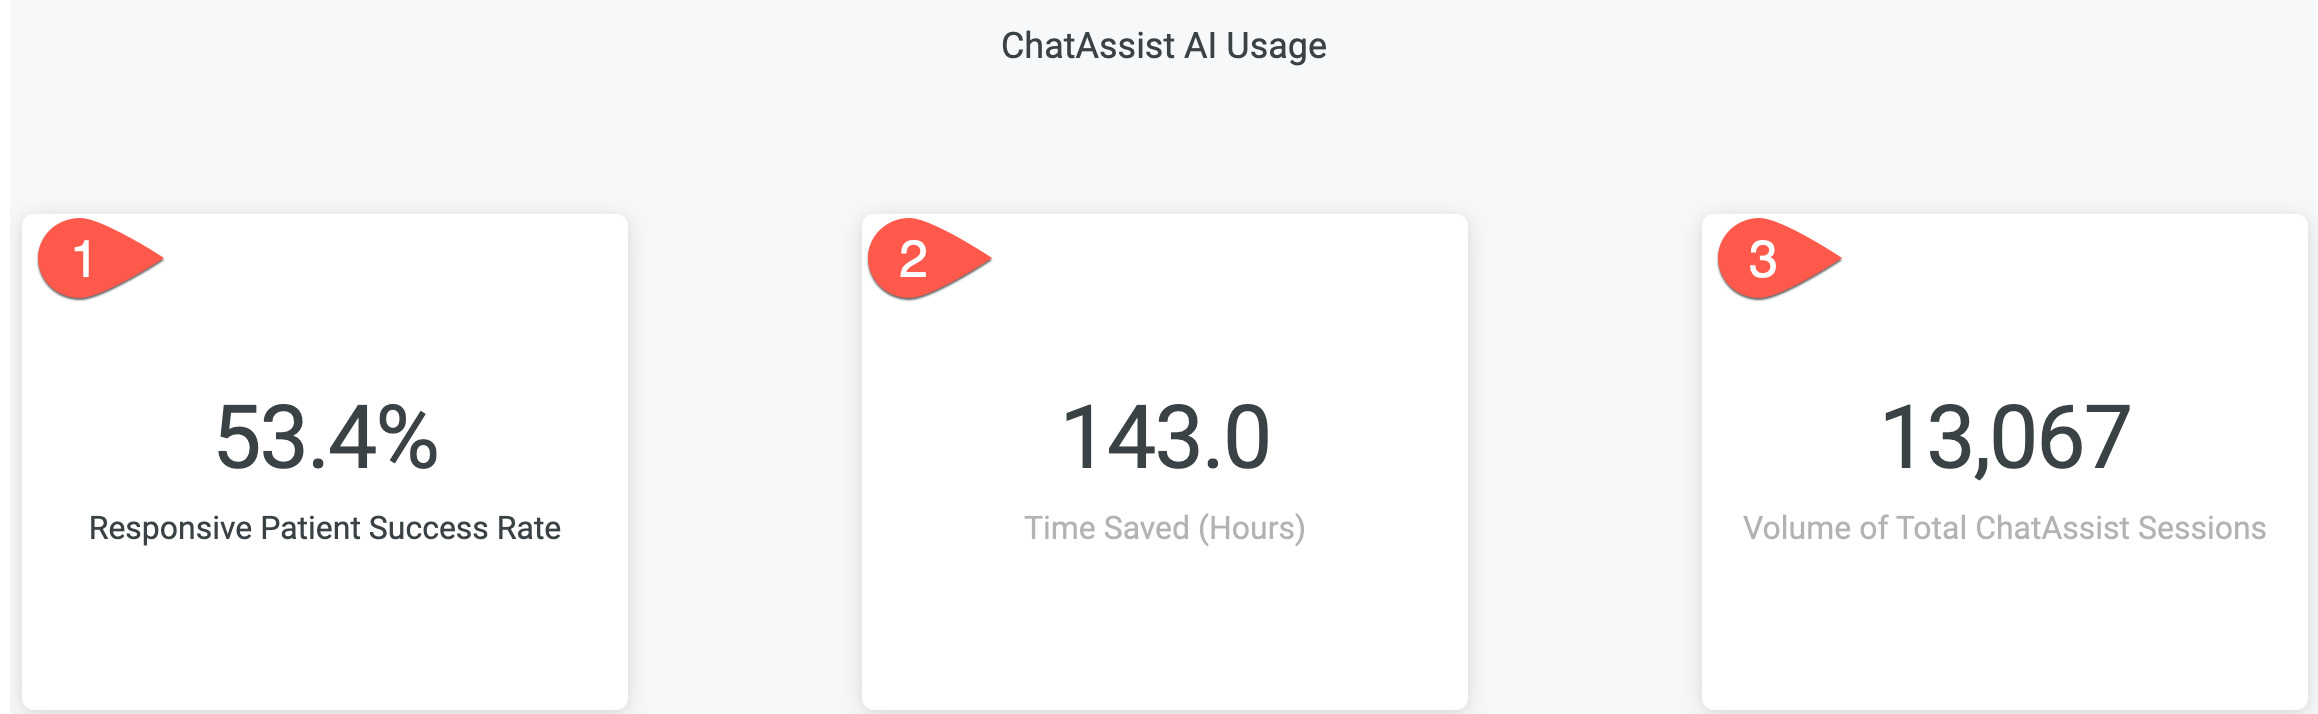
- Responsive Patient Success Rate: The total percent of conversations that were completed by the patient (meaning they made it to the last step in the ChatAssist AI conversation). This percent is based on the total number of patients who engaged with at least one step of the ChatAssist AI Conversation. Patients who do not respond to the ChatAssist AI Conversation at all will not be included in the total.
- Time Saved: The estimated number of hours saved through ChatAssist AI Conversations. This is calculated by multiplying each outbound message by the Time Saved Per Message value. This defaults to 15 seconds saved per message and can be adjusted using the filters at the top of the Enterprise Analytics page.
- Volume of Total ChatAssist Sessions: The total number of initiated ChatAssist AI Conversations within your Artera platform.
Authentication Timeout Message
The Enterprise Analytics Dashboard automatically times out after 15 minutes of viewing. Simply refresh your page to reload the data.
.jpeg)