DeleteLearn more about Analytics Plus by completing the Analytics Plus Training Course in Artera Academy.
The #Artera Analytics Plus folder contains a standard set of key Dashboards and Looks. This folder provides reporting for Campaigns, Automations, Patients, Opt-Outs, User/Patient Interaction, Appointments, Deliverability, and Messaging. This folder is available to all users within the Shared Folders section of their Artera Analytics Plus environment.
Delete
A Note about Standardized Reporting
These reports cannot be customized for individual Enterprises. However, if you have a suggestion on how these reports can be improved for all users, please contact your Artera representative and they will create a ticket. While these tickets are collected and shared with our development team, we cannot promise that these ideas will be incorporated into standard reporting.
Definitions
Dashboards
Dashboards collect multiple reporting metrics into a central reporting space. These Dashboards include overall filters that apply to the whole reporting set (e.g. Practices, Date Ranges, etc.) and filters that can be applied to each tile (individual data component) or set of tiles. Dashboards allow for the most customization and filtering.
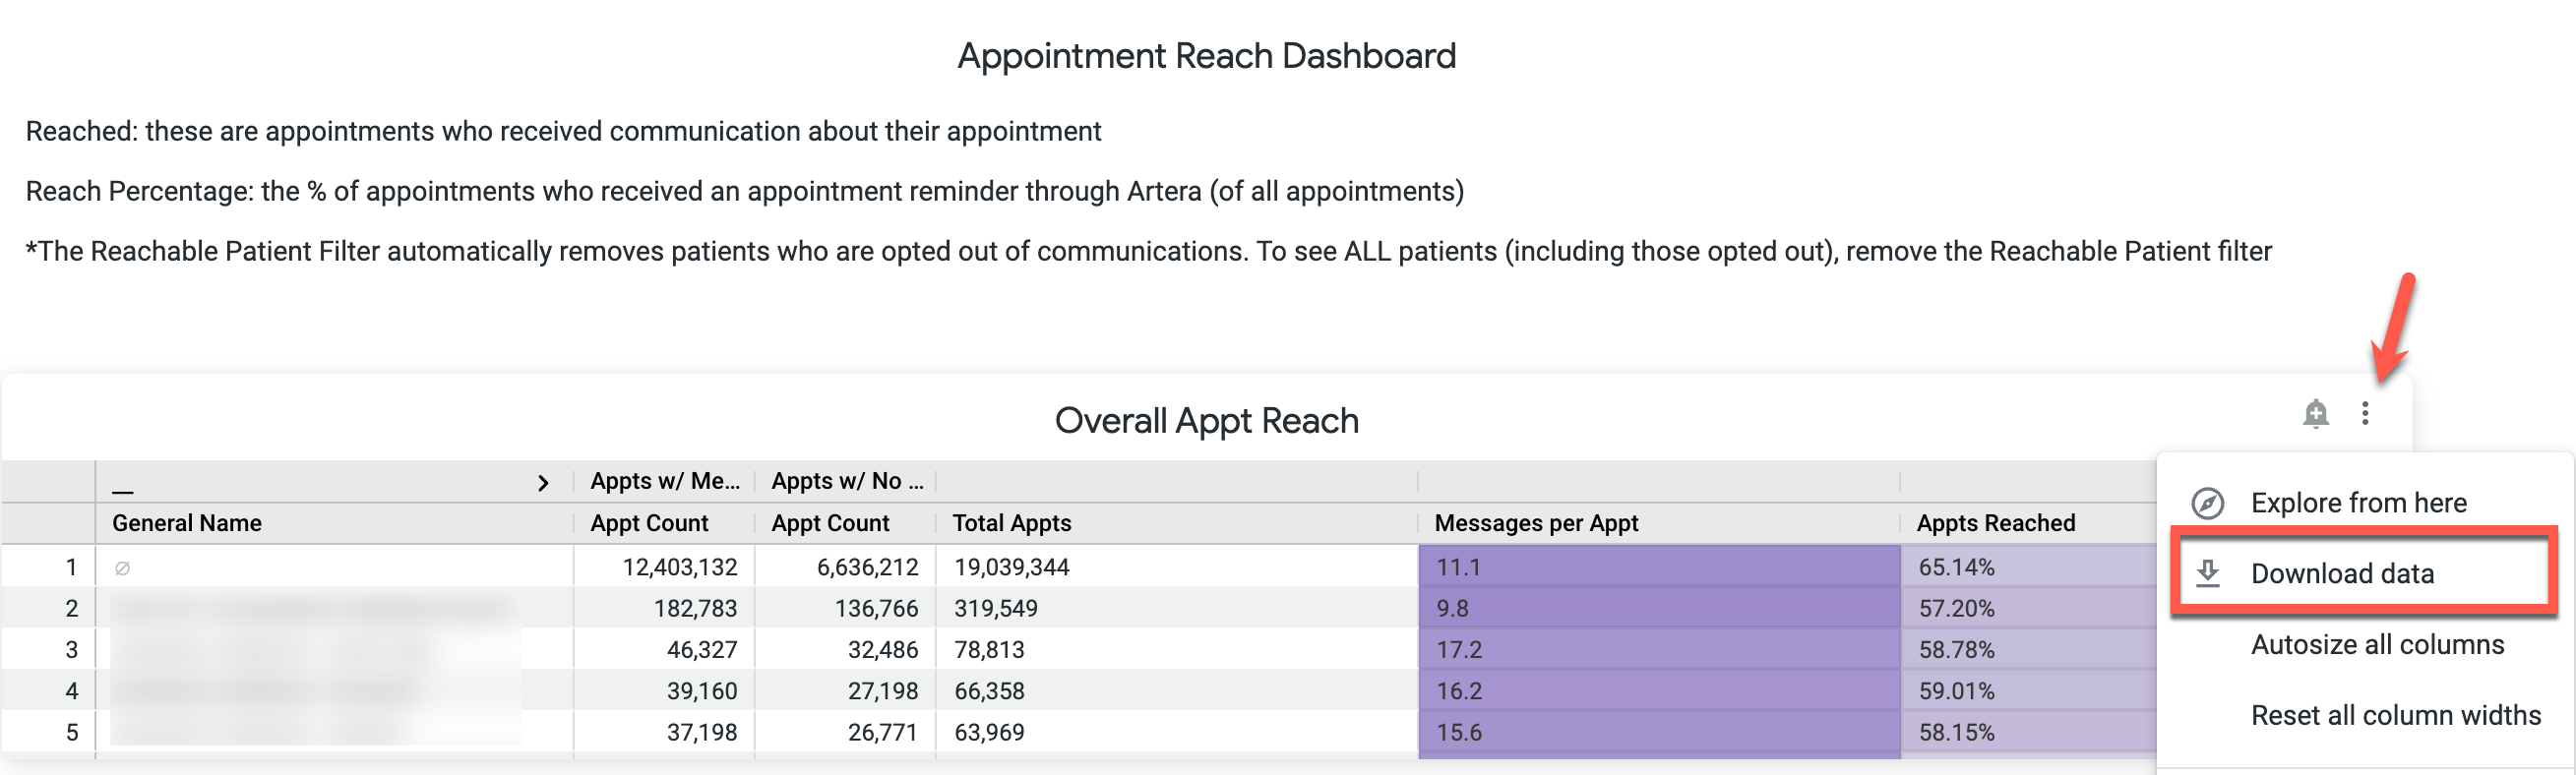
When downloading Dashboards, you can download results of individual tile(s) or the full Dashboard. To download an individual tile, select the tile's three-dot menu and choose Download data. Then, choose the file format to download the tile in.
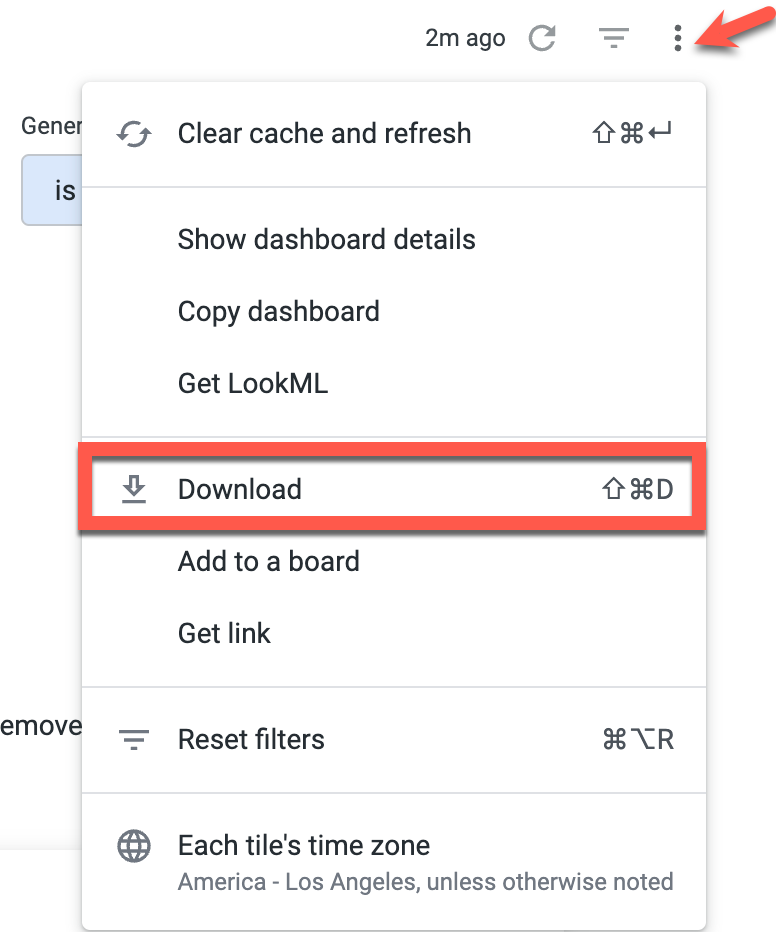
To download an entire Dashboard, select the Dashboard's three-dot menu on the right-hand side of the screen and choose Download:
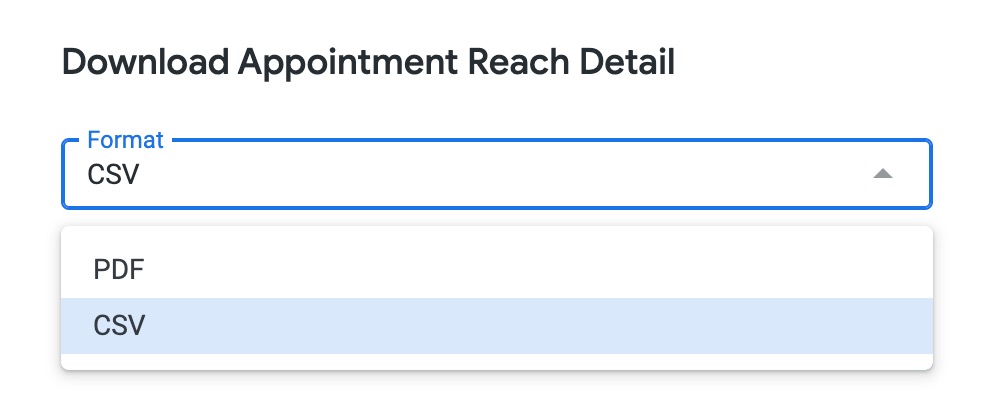
Choose the format of the file to download the Dashboard in (CSV or PDF):
Looks
Looks are reports that focus on one specific data-set like Appointments, Campaigns, or Referrals. These Looks can be customized using filters to identify specific KPIs or provide a high-level overview of the data.
Looks can include calculations like:
Conversion or success rates;
Percentage of people using specific Artera features;
Which Practices or Providers are consistently getting Recalls or Referrals; or
Count of patients receiving a specific type of care or of scheduled appointments in a given timeframe
To download a Look, select the Look's gear icon on the right-hand side of the screen and choose Download:
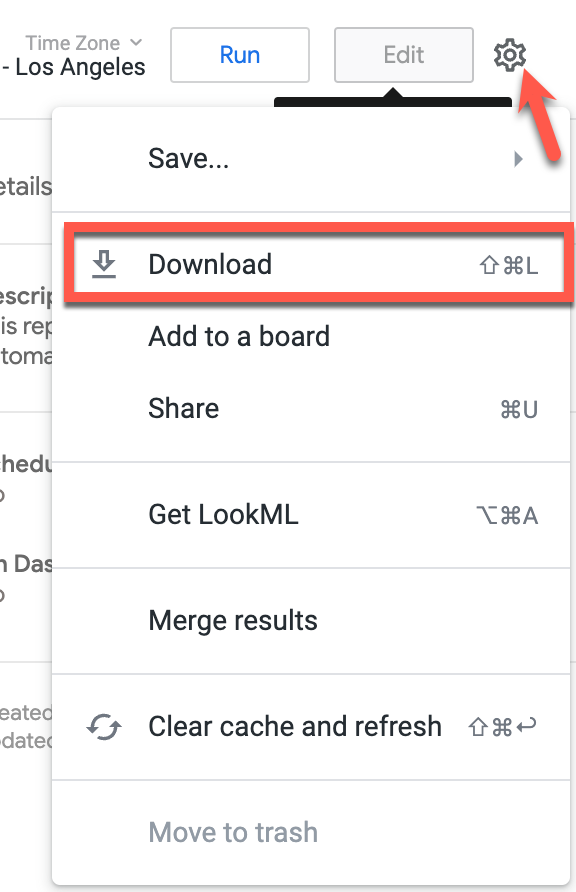
Choose which file format to download the Look in. By default, Looker limits results to 500 rows of data within the platform. If you would like to download the full set of report data, make sure to select All Results for the Limit. Once ready, select Download.

Delete
A Note about your Artera Analytics
If interested in learning more about your Artera data and deep diving into KPI metrics for your organization, please reach out to your Customer Success Representative for additional information and details on benchmarks.
#Artera Analytics Plus Dashboards
The following Dashboards are available in the #Artera Analytics Plus folder:
Report |
Description |
Audience |
Usage Frequency |
Appointment Reach Detail |
Understand how many patients are receiving communication about their appointments and view various breakdowns of that data by time, provider, event, etc. |
IT or Practice Managers |
Very specific items reviewed for client strategy or expansion |
Campaign Effectiveness |
Understand the impact of your Campaigns through response rate, patient reach, booked appointments, and delivery metrics. Use this Dashboard to compare different Campaign methodologies and gauge patient interest. |
IT or Practice Managers |
Very specific items reviewed for client strategy or expansion |
Deliverability Dashboard |
Understand communication delivery by each communication method (text, call, and email) for Automations, Campaigns, Broadcasts, and Manual Messages. |
Practice Managers |
Quarterly |
Executive Dashboard |
Understand your Artera usage through the ‘at a glance’ section. This dashboard contains data on patient reach, response rates, staff messaging, and patient response time for the past month and 12 month periods. |
Executives and Practice Managers |
Regularly |
Link Clickthrough Rate |
Understand how patients interact with links shortened through Artera's link shortening service, including a breakdown of clicks by patient. |
IT Team |
Rarely reviewed |
Mentions Dashboard |
This dashboard is built to give reporting insights into your Internal Mentions functionality. The Mentions Dashboard shows the cumulative mentions and percent of unresolved mentions in a given time period. It also breaks down mentions by user, practice user, group, and enterprise user groups with resolve time statistics. |
Admin |
Weekly |
No Show Trends |
Review no-show rates over time including a breakdown of no-shows based on appointment reminder response (e.g. percent of patients who no-showed after confirming their appointment). |
Practice Managers |
Quarterly |
Patient Opt Out |
Review the opt-out trends by Patient and Channel. Additionally, review how the patient opted out of SMS messaging (e.g. Patient, Admin, etc.). |
Practice Managers |
Quarterly |
Patient Response Time Dashboard |
Understand how quickly you are responding to patients and see your metrics ranked against other customers. |
Executives and Practice Managers |
Regularly |
Quick Response Dashboard |
Understand how Quick Responses are being used across your Enterprise and Practice(s). Metrics include the percent of messages per user and Enterprise that are Quick Responses, last date a Quick Response was used, and the most utilized Quick Response per Practice. |
Executives and Practice Managers |
Regularly |
User Activity |
Understand how your users are using Artera, including patient messaging details, Channel Status changes, active usage, and average Channel open time. |
Practice Managers |
Quarterly / Semi-Annually |
| Patient Engagement Benchmark Report |
Understand how your performance compares to that of similar organizations based on benchmarks related to important patient engagement metrics.
NOTE: This Dashboard is part of our Artera Harmony offering. Please connect with your Customer Success Representative for more information.
|
Executives and Practice Managers |
Quarterly |
| No-Show Recovery Dashboard |
Gain insights on the value of following up with patients who do not show up for their appointments and the estimated revenue recovery as a result.
NOTE: This Dashboard is part of our Artera Harmony offering. Please connect with your Customer Success Representative for more information.
|
Executives and Practice Managers |
Quarterly |
The following Dashboard is available in the Enterprise Analytics folder from within the #Artera Analytics Plus folder:
Report |
Description |
Audience |
Usage Frequency |
| Embedded Enterprise Dashboard |
Review Enterprise metrics that demonstrate the effectiveness of Artera while helping you discover areas for opportunity. |
Enterprise Users |
Regularly |
#Artera Analytics Plus Looks
The following Looks are available in the #Artera Analytics Plus folder:
Report |
Description |
Audience |
Usage Frequency |
Automation Link Tracking Report |
Understand how patients interact with links shortened through Artera's link shortening service and delivered through Automations including a breakdown of clicks by patient. |
IT Team |
Rarely used or used for optimization |
Broadcast Effectiveness Report |
Understand who sent a Broadcast, how many patients were reached, and the response volume. |
IT or Practice Managers |
Very specific items reviewed for client strategy or expansion |
Build Report |
Understand all Automations that exist within each Practice, including the Default Automation template they are configured off of. |
IT Team |
Rarely Used |
Campaign Deliverability |
Understand how many of your Campaign messages are not delivered successfully. |
IT or Practice Managers |
Very specific items reviewed for client strategy or expansion |
Campaign Patients with Undelivered Outreach |
Determine which patients did not receive the selected Campaign. |
IT or Practice Managers |
Very specific items reviewed for client strategy or expansion |
Campaign Responses |
This report shows inbound message content and details from patients who have responded to Campaign messages. The report can be filtered by Campaign, keywords, and date range. |
Campaign Admin |
Weekly or Monthly |
Custom PRT Look |
Set your preferred threshold for patient response time and understand how long it takes for users in your Practice to respond to an open Patient Channel. |
Executives and Practice Managers |
Regularly if you are using custom response time and not Artera benchmark |
Deliverability by Automation |
Understand Automation deliverability by selected Automation(s) and further filtered by message date. |
IT or Practice Managers |
Very specific items reviewed for client strategy or expansion |
Full Automations Breakdown Report |
This report shows all automations created per practice, along with an extremely granular view of many associated fields, such as: Automation types, IDs, verbiages in English and Spanish, etc. |
Admin |
Weekly or Monthly |
Inbound Keyword Automation |
This report provides information on the number of messages and the unique number of patients receiving automations. This report is grouped by Automation templates and the text criteria required for triggering the Automation. |
Admin |
Quarterly |
Inbound Keyword Report |
Understand what patients are saying and use this data to create Inbound Keyword Automations, Quick Responses, or Manual Messaging guidance.
Tip: Need to know specific words. |
IT or Practice Managers |
Very specific items reviewed for client strategy or expansion |
Inbound Message Volume |
This report displays information on the number of messages and unique number of patients sending those messages for inbound volume to Artera clients. This excludes common responses such as “y, n, confirm" and similar common responses. This report helps gauge what patients are texting in to determine other questions, comments, or concerns they can resolve with an Inbound Message Automation. |
Admin |
Monthly or Quarterly |
Manual Messaging |
View the messages sent directly to patients by Artera users.
Tip: Virtual Waiting Room |
IT Team |
Rarely Used |
Opt Out / In Via Short Codes or Mass Messaging Number |
Understand which patients have opted in or out of text messaging from Artera through your short code or high-volume toll-free number. |
Practice Managers |
Rarely Used |
Opt Outs |
Understand the count of patients who opted out of receiving text messages from Artera. This can be filtered by cause (Campaign, Automation, etc.) or to show overall opt-outs to better understand patients who need a different communication method or more targeted engagement. |
Practice Managers |
Use for optimization if there were goals or initiatives aligned to match |
Patient Message History |
View consecutive messages sent to and received by the patient through Artera for a detailed list of messages for a given patient in the chosen date range.
Tip: This report takes awhile to load. Typically is used for printing a dispute conversation that occurred in Artera.
|
IT Team or Practice Managers |
Typically used to troubleshoot |
Patient Opt Out to Campaigns |
Understand which patients opt-out of text messaging after receiving a specific Campaign. |
Practice Managers |
Use for optimization if there were goals or initiatives aligned to match |
Patient Status Update |
View the status of an appointment (e.g. confirmed or canceled). |
Practice Managers |
Quarterly |
Patients that Exist in Artera (Verified or Unverified) |
This report contains a complete list of Artera patients and their classification as verified or unverified. This report does not display patients without a Patient ID/MRN. |
IT or Practice Managers |
Quarterly |
PES Results (Patient Satisfaction Survey) |
Review survey results based on the Patient Engagement Surveys sent as part of your appointment follow-up Automations. |
Executives and Practice Managers |
Regularly |
Practice and Location Information |
Review the Location information for each Practice, including Address, name, phone line, and number. |
IT Team |
Rarely Used |
Response Rate by Automation |
Understand how many patients respond to messages containing the {eventConfirmText} or {eventConfirmLink} Smart Phrases. This report pulls data based on the message send date (not the response date). This report can be filtered and organized by Practice name. |
IT or Practice Managers |
Very specific items reviewed for client strategy or expansion |
Response Rate by Automation by Date |
Understand how many patients respond to messages containing {eventConfirmText} or {eventConfirmLink}. This report pulls data based on the message send date (not the response date). This report is ideal for comparing 5 or fewer Automations. |
IT or Practice Managers |
Very specific items reviewed for client strategy or expansion |
Undelivered Messages |
Understand who has not received your SMS communication. |
IT or Practice Managers |
Semi-annually |
Undelivered Messages by Practice and Line |
Understand who is not receiving your SMS communication. |
IT or Practice Managers |
Very specific items reviewed for client strategy or expansion |
Wrong Number Inbound Messages |
Review any patients who texted in “wrong number” providing a list of patients who need updated contact information. |
IT Team |
Rarely Used |
Message Class Definitions
Message Classes are the classifications of a message, either by sender, content, or delivery method. The following reports are commonly broken down by Message Class:
Manual Messaging - allows you to view the messages sent to patients by users
Patient Message History - allows you to view consecutive messages sent to and received by a patient through Artera for a given patient in a specified date range
Use the table below for descriptions of each Message Class:
Message Class |
Definition |
Automation |
These are messages that are automated and pre-templated per customer, usually soliciting a response. This does not include the child messages of a Merged Message. |
Campaign |
Campaigns are bulk messages sent to patients per an uploaded CSV or patient list. These are usually general announcements or “promotions.” |
Broadcast |
Broadcasts are similar to Campaigns but instead of an external upload, you can select which patients to send the message to from within the platform. These are typically utilized for same-day events. |
Manual |
Manual Messages are not automated or pre-generated, they are outbound messages sent by a user to a patient. |
Mention |
Mentions are internal messages which have an internal group / user associated with them |
Merged Message |
Merged Messages are the child messages that got merged into the one automation that was sent out. These are not seen by the patient but are shown in the Patient Channel. |
Event |
Catch all for anything that has an Artera destination such as channel status change, patient/appointment change, or other tracking. These appear as white, timestamped boxes within the middle of the Patient Channel. |
Other |
This contains messages that fall into: Conversation Builder messages beyond the first message (first message could be an Automation, Broadcast, Campaign or Manual Message), Out-of-Office Reminders, Holiday Hours (similar to above), Line not activated for SMS, Automated Line Messages. |
Livechat |
These messages are associated with the Livechat feature. It is important to recognize that there may not be true patient details associated with these messages. |
Inbound |
These are incoming messages, likely from the patient. This could also include spam messages coming into the platform. |
SendMessage API |
SendmessageAPI enables third party applications to use Artera as an SMS gateway to deliver messages generated and triggered within said third party applications - including but not limited to 2-factor authentication, portal notifications and family notifications, among others. Note that the content of the message and the recipient are all decided within the third party app. |
Understanding Report Fields
Understanding what each data field represents and the information it pulls into your report is important to ensure accurate report comprehension. To better understand each field in your report, we recommend hovering over the field in the Dashboard or Look. This will display a brief description of what that field represents within the report.
