Referrals Reporting
- Get Started
- Automations
- Patient Channel
- Patient Facesheet
- Collaborative Inbox
- Lines & Resources Requests
- Lines, Events, Resources
- Analytics
- Platform Settings and Configuration
- Users and Groups
- Campaigns
- SMS Basics
- Troubleshooting and FAQ
- Conversation Builder
- Add-Ons
- Release Notes
- Technical Specifications
- Referrals
- Self-Rescheduling
- Recalls
- Marketplace
- Conversation Manager
Table of Contents
Referral Message Performance Dashboard Referral Message Performance Dashboard Tiles Referral Message Type by DayReferral Acceptance Rates and CountReferrals DrilldownReferral Automation DeliverabilityReferrals Created and ReachedReferral Reach MetricsReferrals not Reached by Communication TypeOpt OutsRolling Response BreakdownReferral Acceptance MetricsDeliverability ReportsReferral Performance ReportReferral reporting is generated exclusively through Artera Analytics Plus. The Referral Message Performance Dashboard and the Referral Performance Report are available for analyzing your Referral outreach metrics.
The Referral Message Performance Dashboard and the Referral Performance Report must first be added to your Enterprise's custom Looker folder. If you are an Artera Analytics Plus customer and do not see these reports in your Enterprise's folder, connect with your Customer Success Representative to request access.
NOTE: The Referral Message Performance Dashboard is available to all Referrals Management customers. The Referral Performance Report is a separate report outside of the Referral Message Performance Dashboard and is only applicable to customers with an active HL7 ZF1-8 feed. An Artera representative will work with you to ensure your Referrals integration meets Artera's requirements to leverage the Referral Performance Report.
Referral Message Performance Dashboard
The Referrals Message Performance Dashboard tiles include Referral Drilldowns, Referral Reach, and Referral Acceptance Metrics.
Referrals Drilldown: These tiles include information about the to/from Referral Locations, to/from Referral Providers, and further breakdown for Referrals by Procedures, Types, and Diagnoses. You will also view Referral Automation deliverability and Referral Reach at a high-level.
Referral Reach Metrics: Explore Referral Reach by examining unreached Referrals, opt-outs, response breakdowns, and message rates.
Referral Acceptance Metrics: These tiles speak to the acceptance rates of Referrals and how many messages to the patient were needed to solicit that response.
Filters
This report allows you to set multiple report-wide filters including Created Date and Speciality.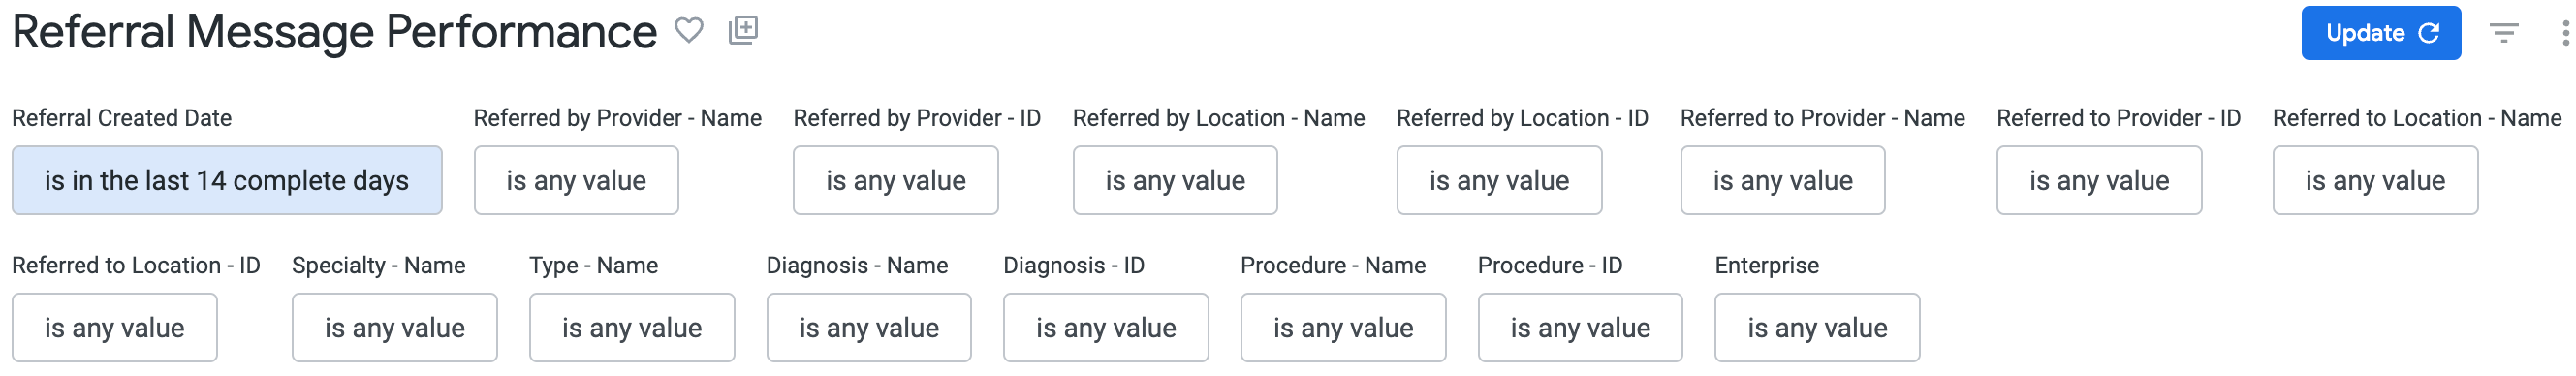
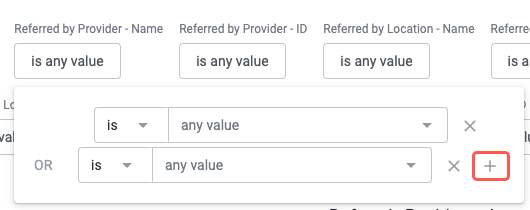
You can choose one or more options for the filters. Use the + icon to add additional OR filter values.
Referral Message Performance Dashboard Tiles
These tiles provide a high-level overview of Referral message types, acceptance rates, and the related to/from Referral Locations.
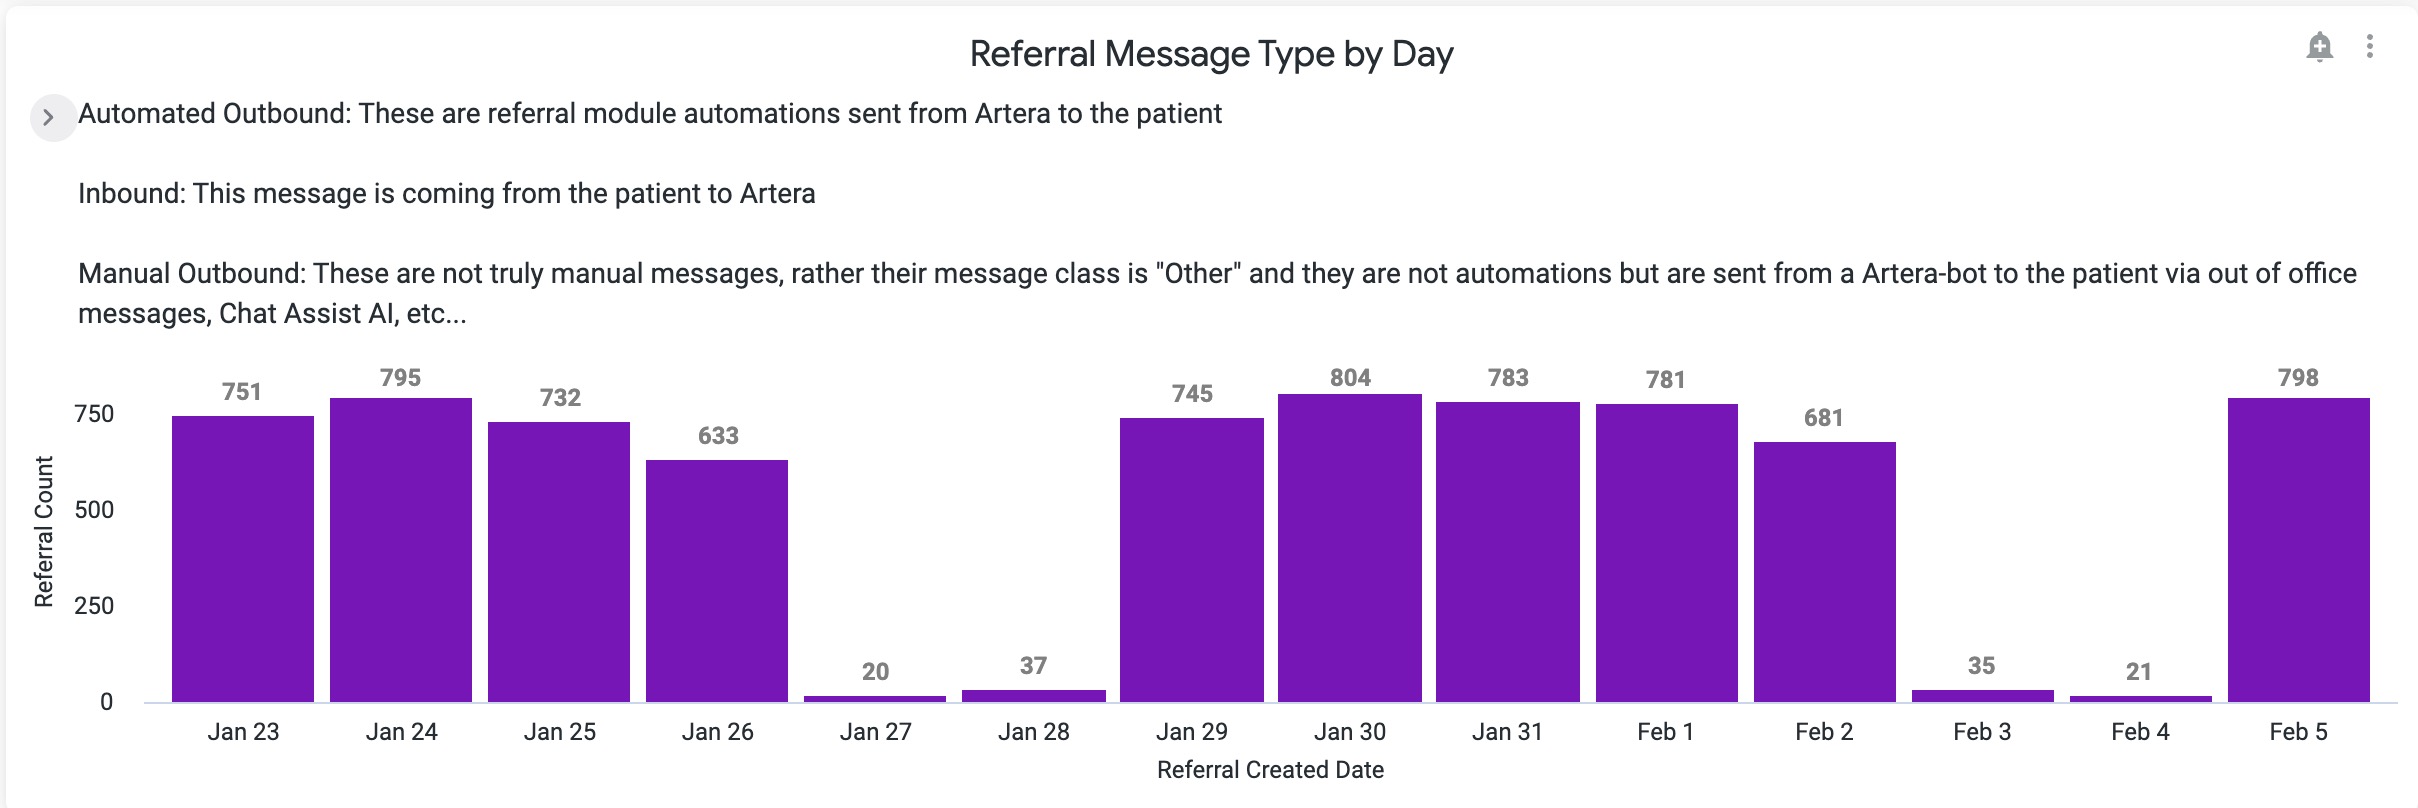
Referral Message Type by Day
This bar chart shows the distribution of Referrals communication through the following message classifications:
Automated Outbound: These are Referral Automations sent from Artera to the patient
Inbound: This message is coming from the patient to Artera
Manual Outbound: These are automated messages sent from Artera to the patient that are not Referral Automations and are not manual outbound messages from staff to the patient. Instead, these are messages sent from a Artera-bot to the patient like After-Hours Auto-Responses, Conversation Builder, Holiday Hours, etc.
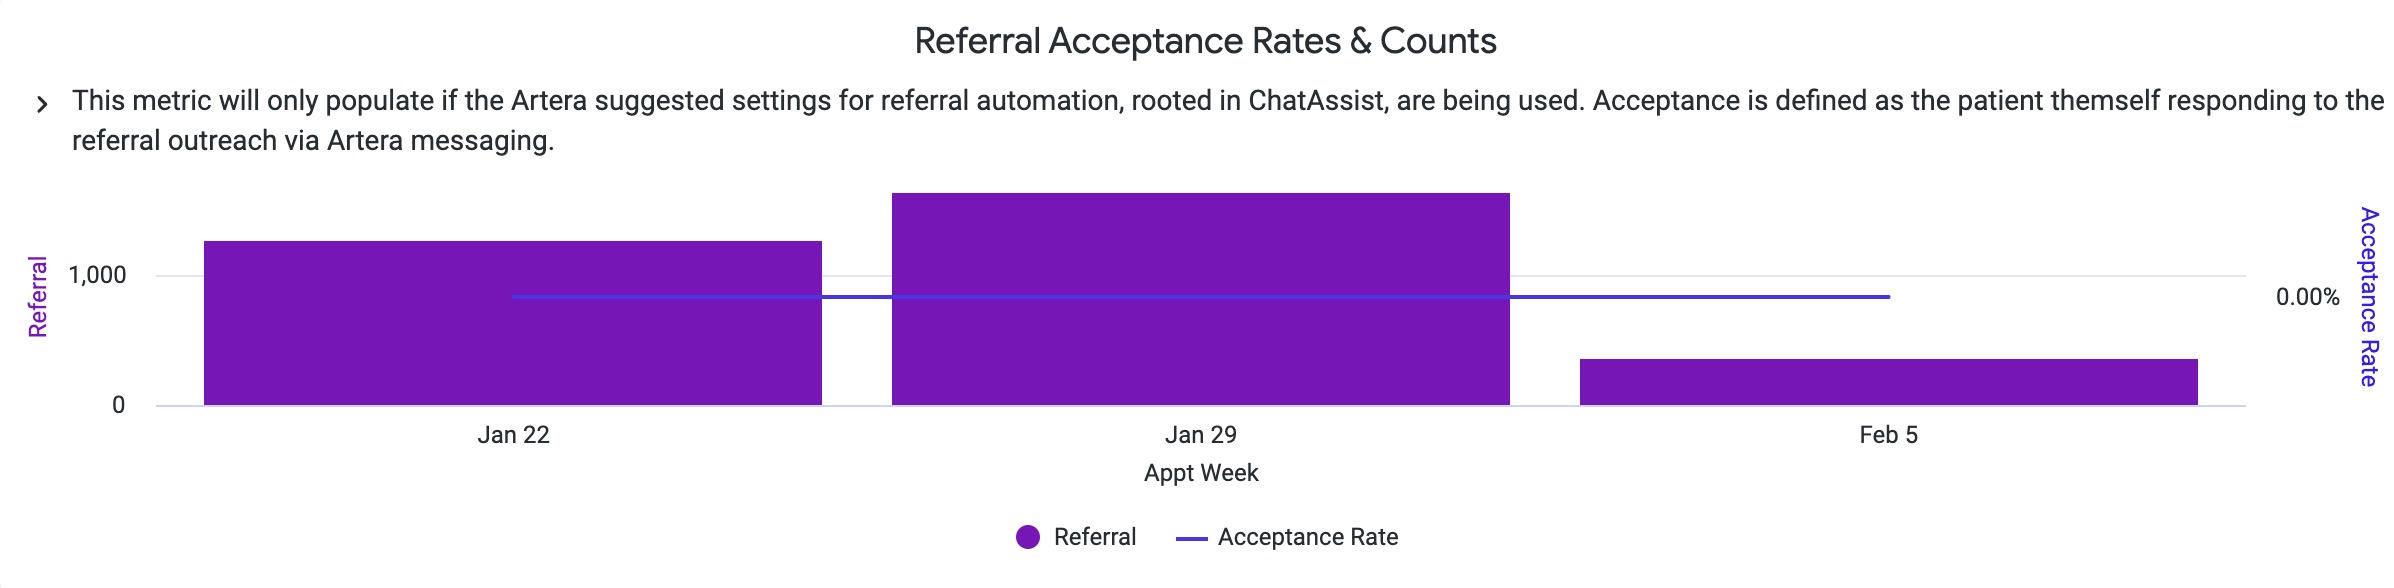
Referral Acceptance Rates & Counts
This bar chart is only relevant for customers who leveraged Conversation Builder as part of their Referral Automation build. Acceptance rate is defined as a patient responding to the Referral Conversation.
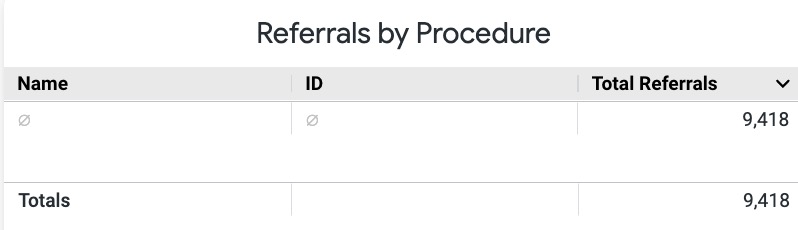
Referrals Drilldown
These tiles include information about the to/from referral Locations, to/from referral Providers, and further breakdown referrals by Procedures, Types, and Diagnoses. You will also view Referral Automation deliverability and Referral Reach at a high -evel.
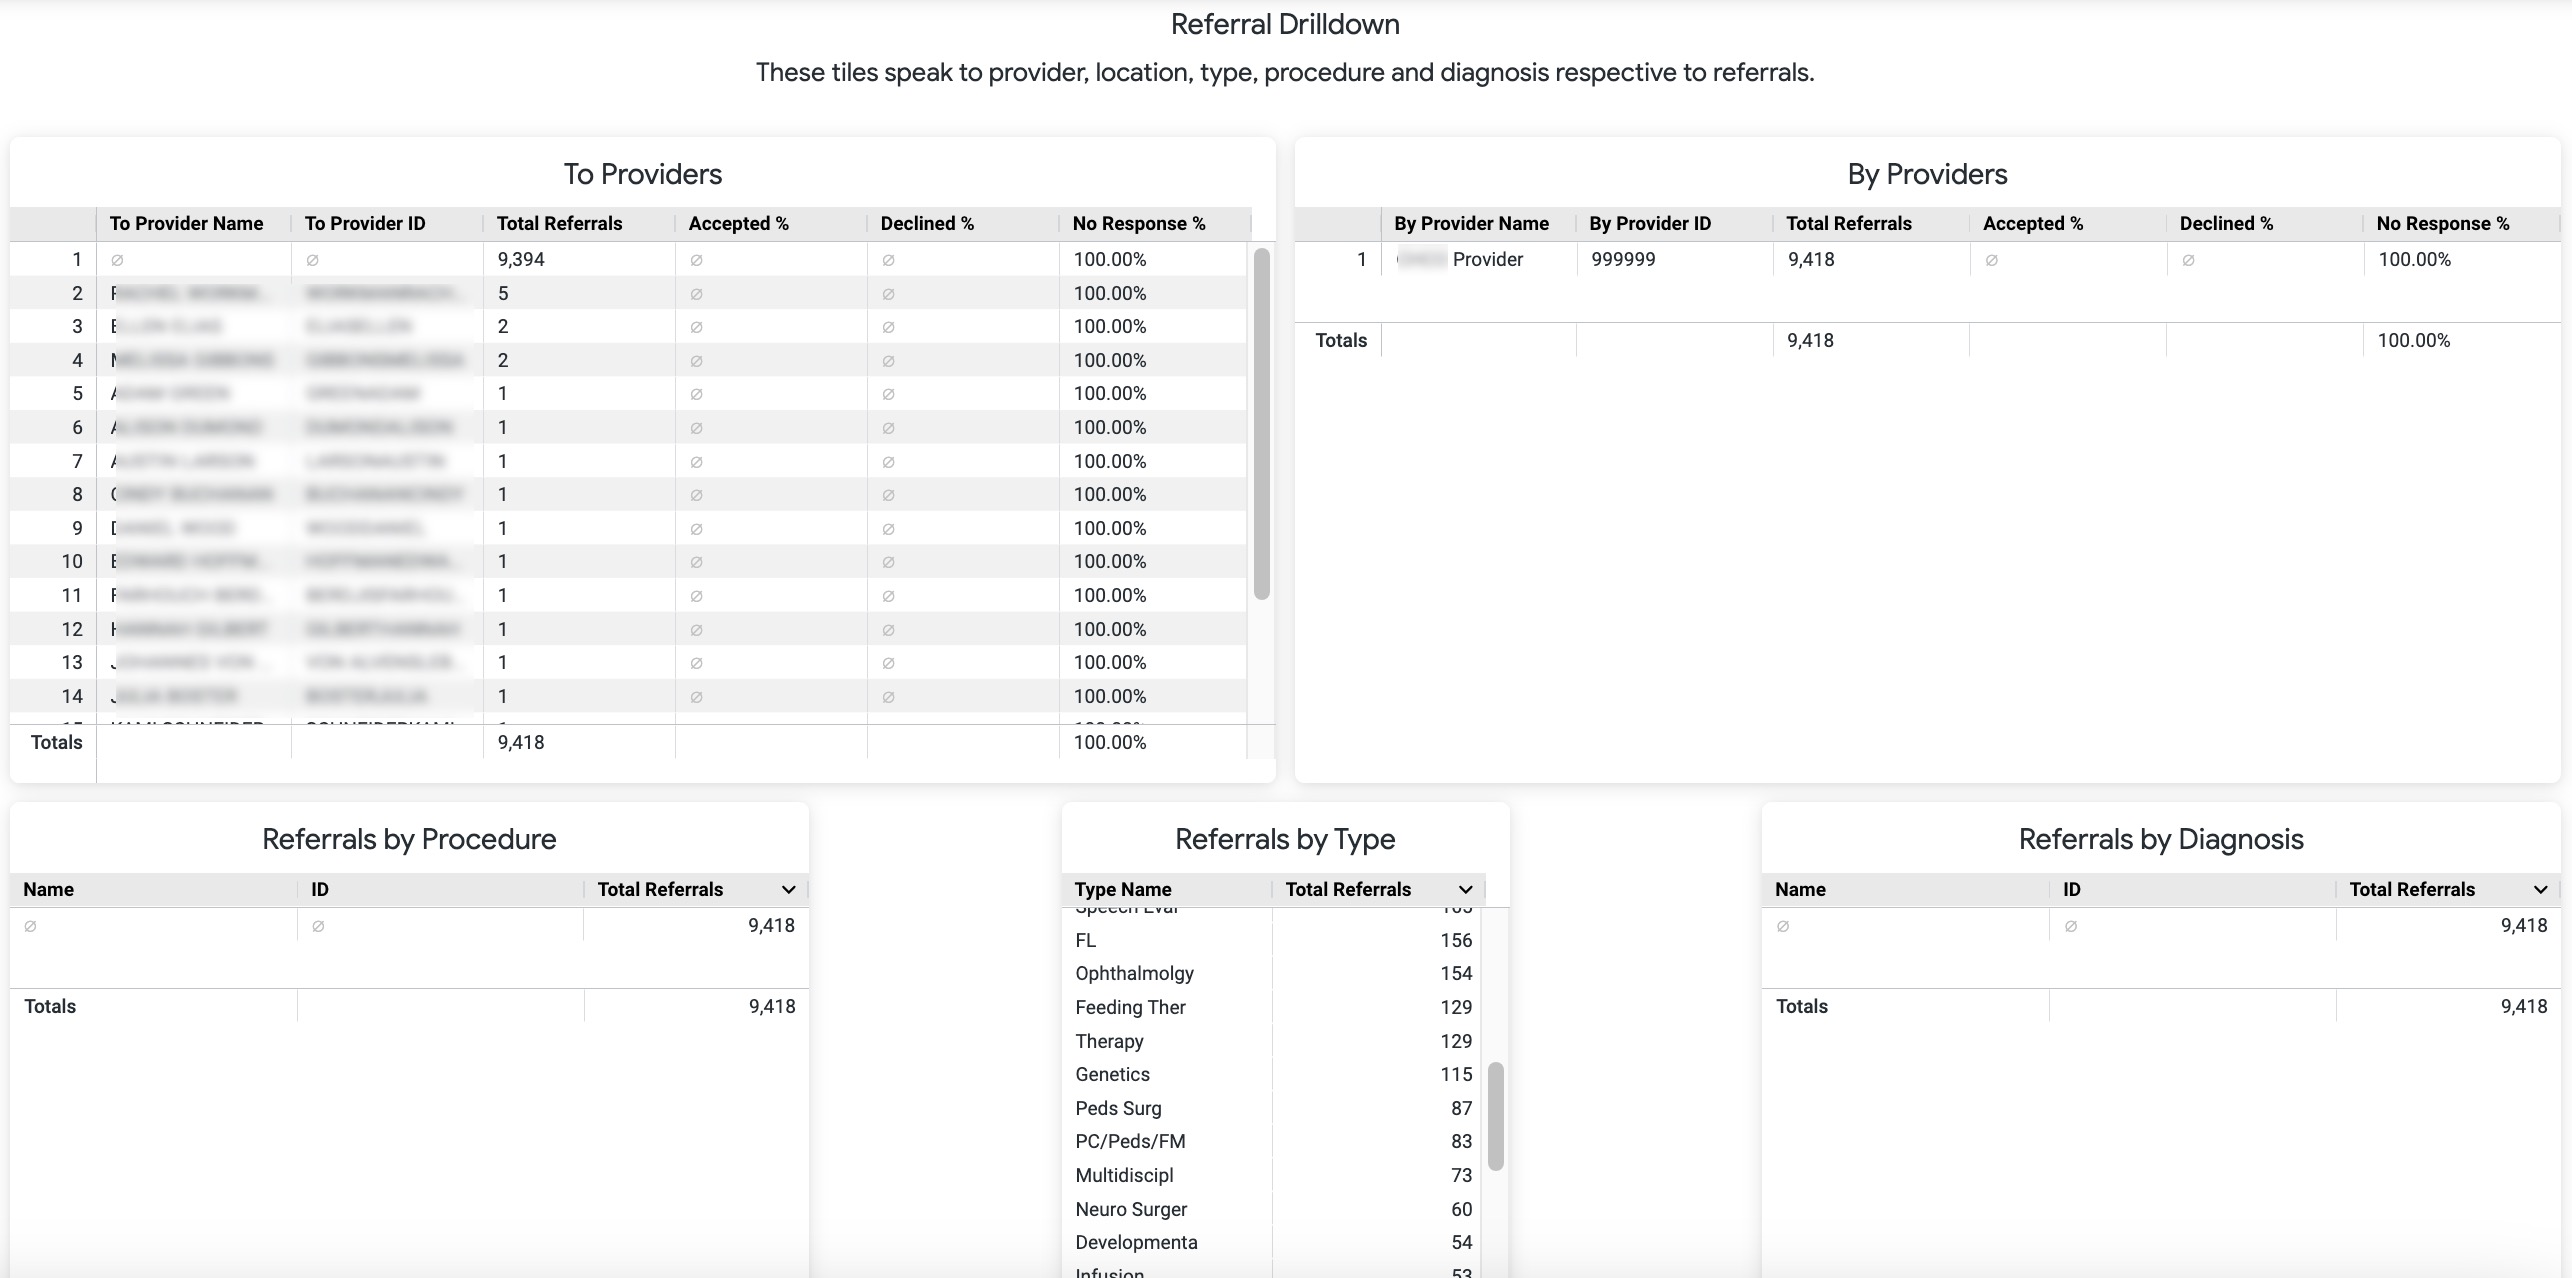
Note: If your organization does not collect one or more of these data points, the tile will display the total number of Referrals for the selected timeframe.
Referral Automation Deliverability
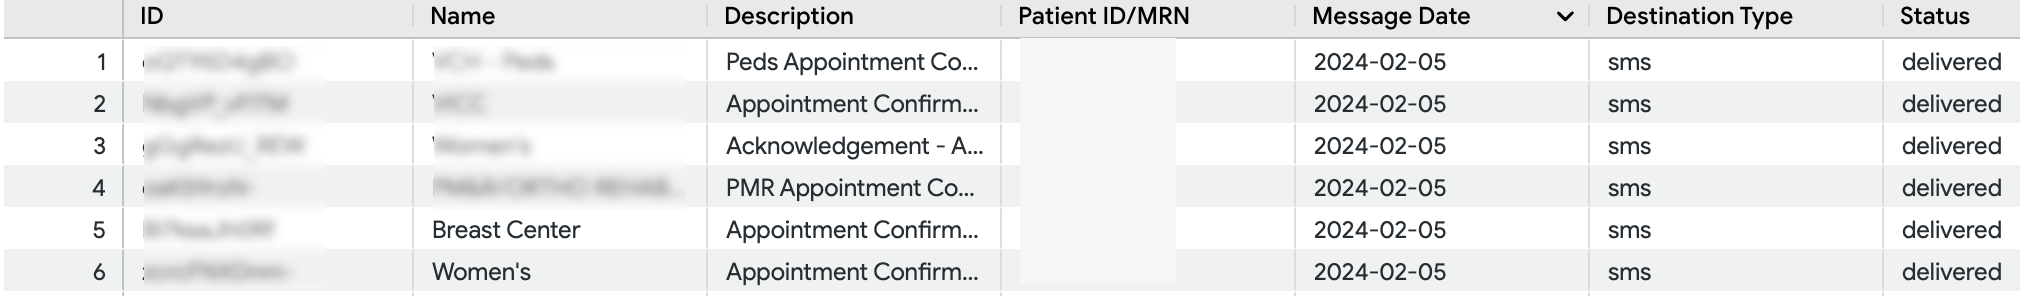
This report displays Referrals based on the date the message was sent from Artera, instead of the Referral created date that is used on the other reports. The Description column here contains the Automation’s description. You will also be able to see whether the message was sent via SMS, Voice, or Email and if the message was delivered successfully.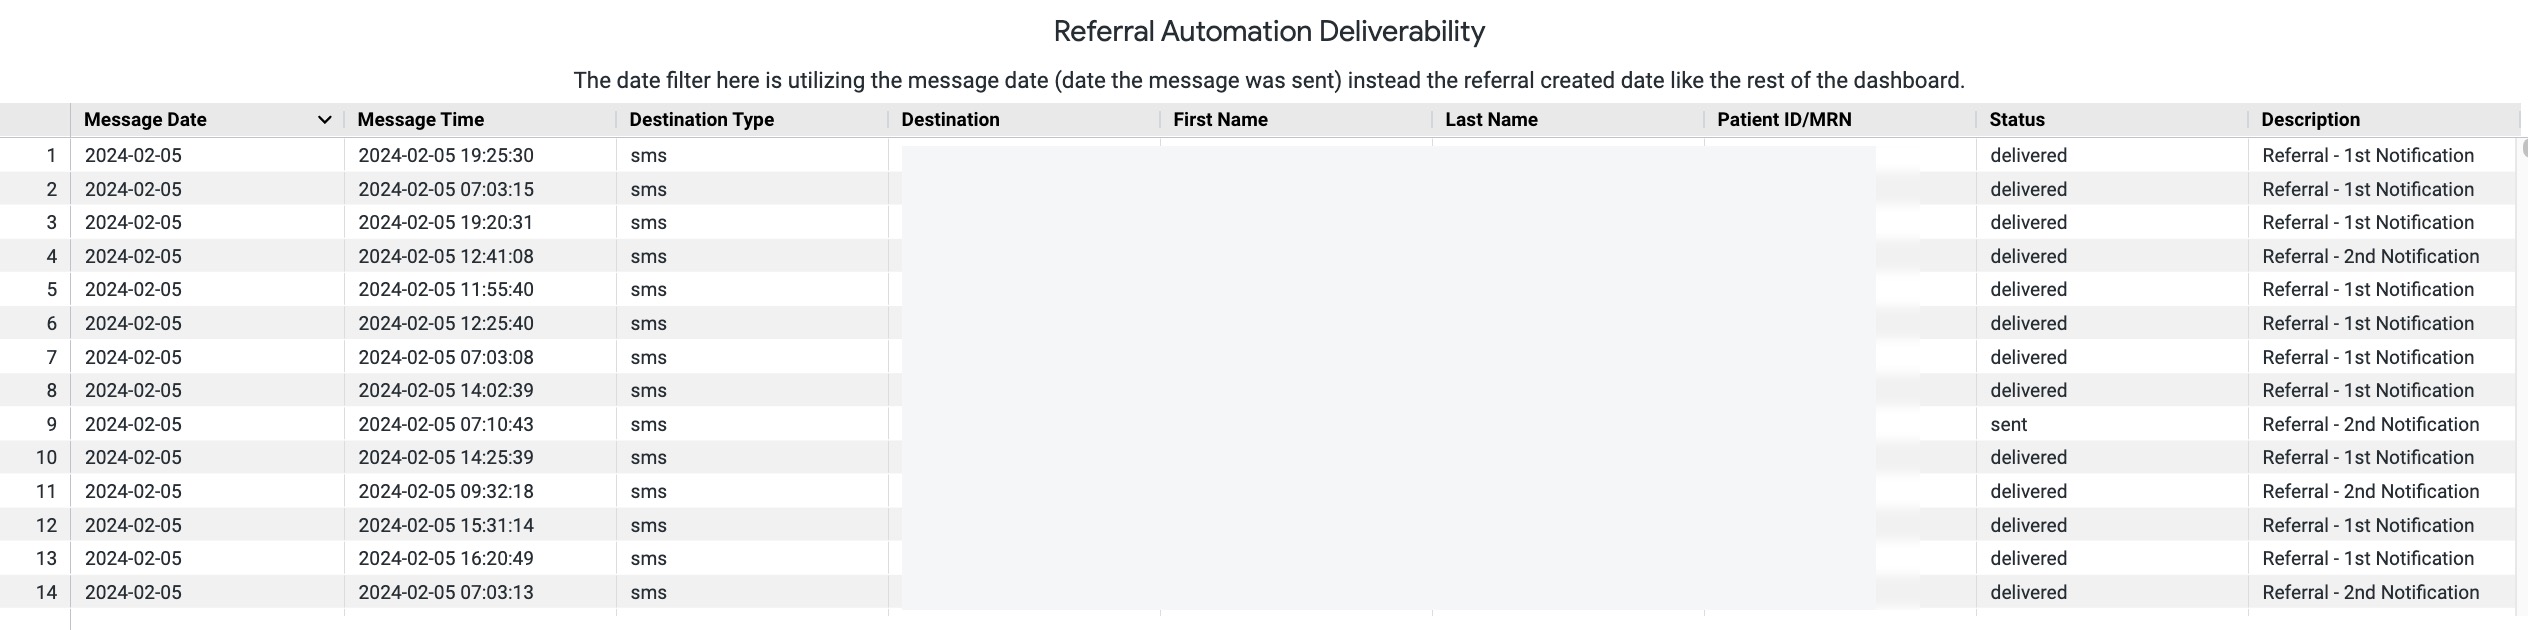
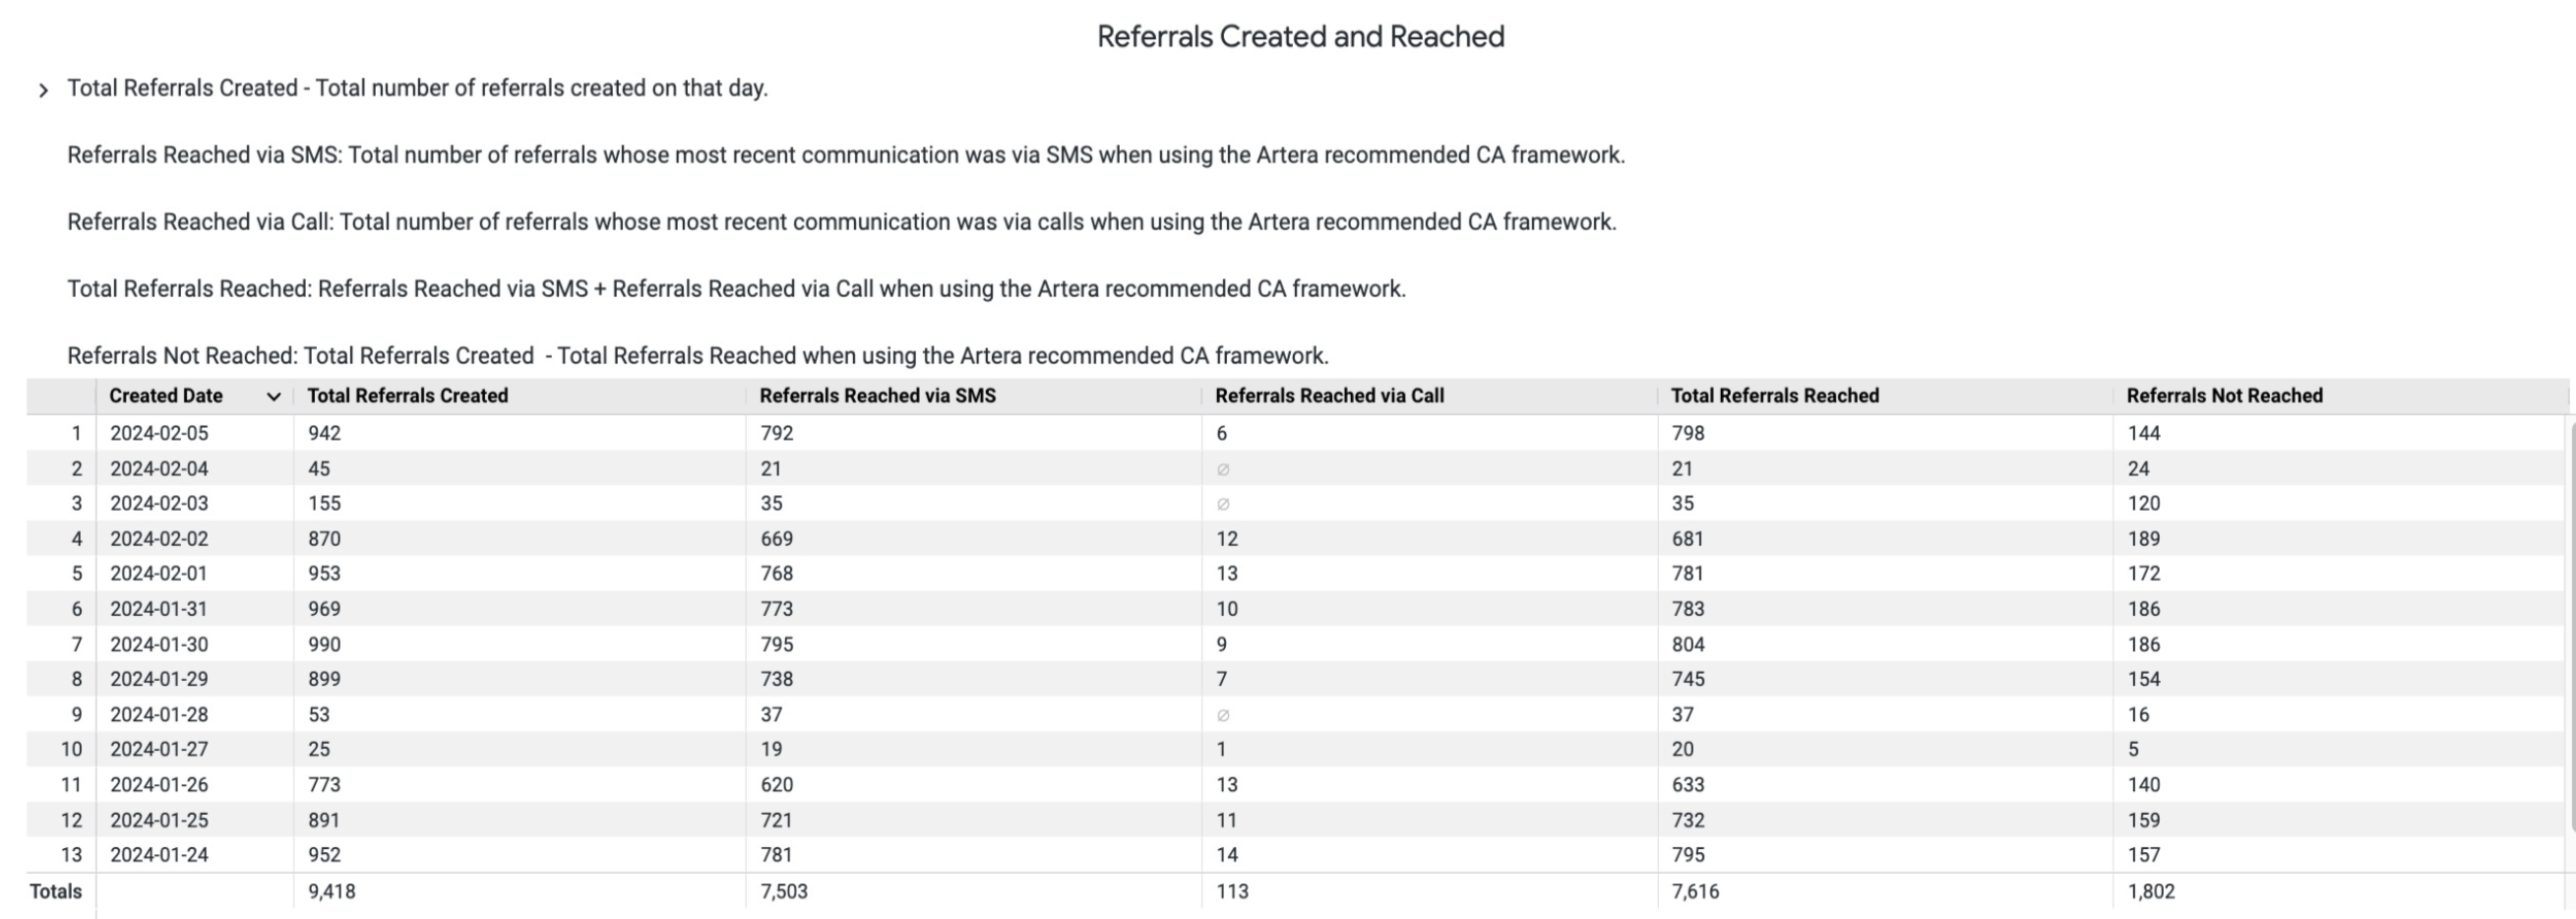
Referrals Created and Reached
Total Referrals Created: Total number of referrals created on that day
Referrals Reached via SMS: Total number of referrals sent by SMS
Referrals Reached via Call: Total number of referrals sent by Phone Call
Total Referrals Reached: Referrals Reached via SMS + Referrals Reached via Call
Referrals Not Reached: Total Referrals Created - Total Referrals Reached
Referral Reach Metrics
Explore Referral Reach by examining unreached referrals, opt-outs, response breakdowns, and message rates.
Referrals Not Reached by Communication Type
These patients were not sent a message or call about their referrals. Drill into this report to view more information on why a patient was not contacted. Additionally, the referral may not be in an authorization or scheduling status that has been configured to receive Automations e.g. doNotSchedule.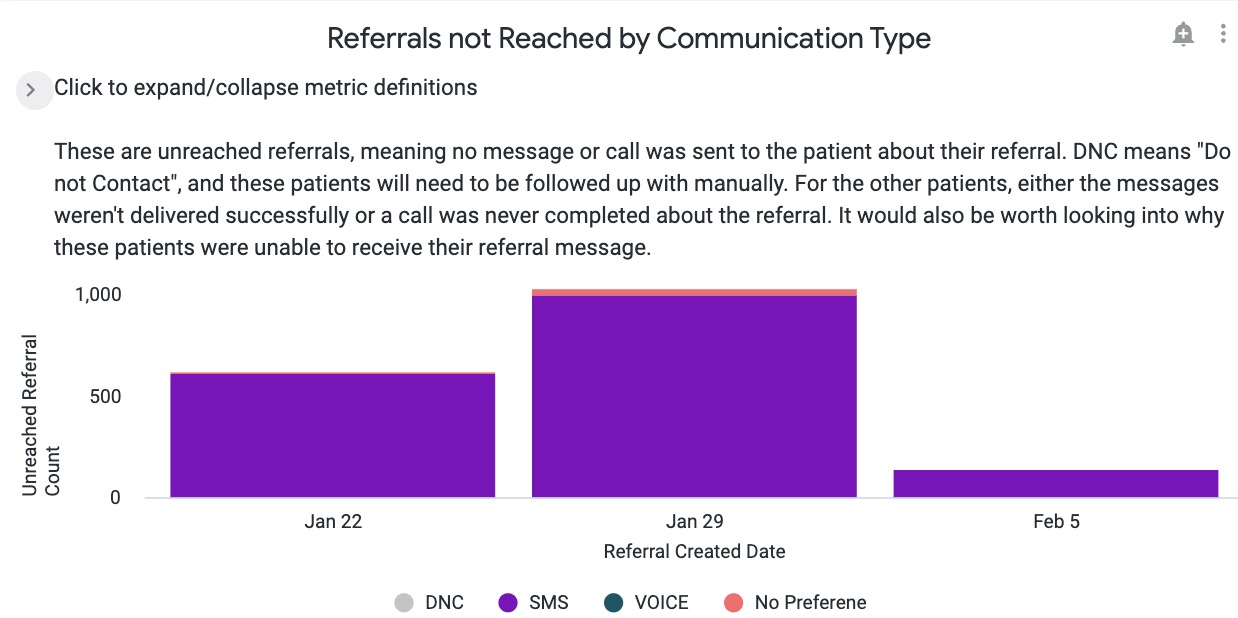
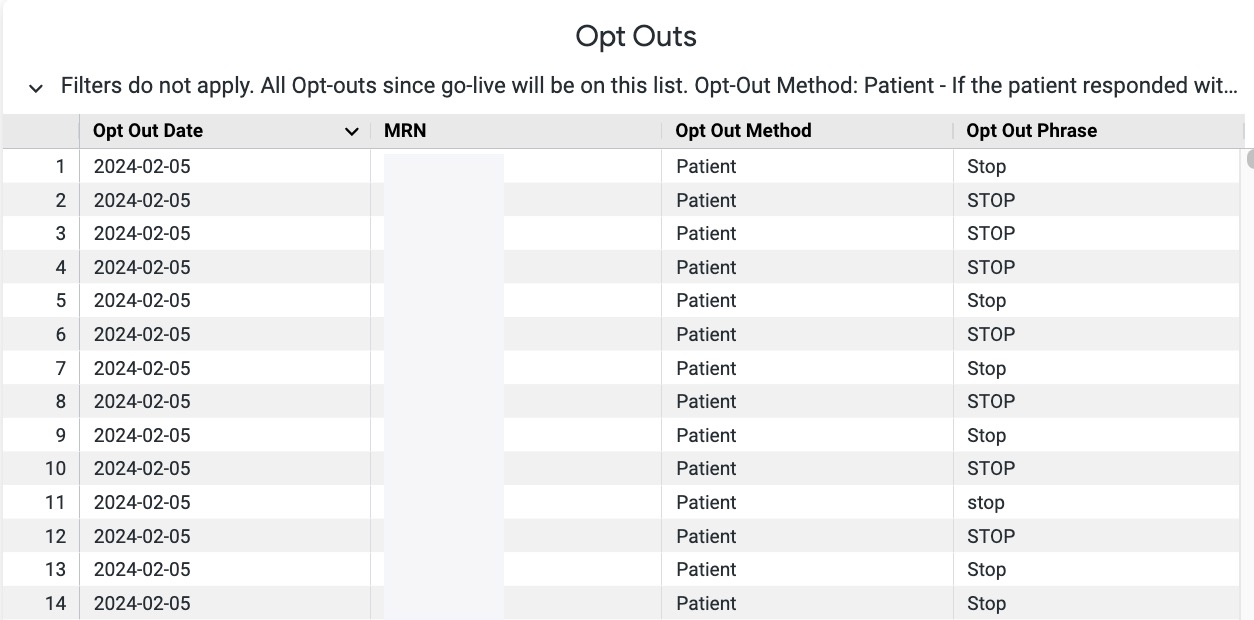
Opt Outs
These patients have opted out of receiving SMS messages or their Texting Allowed toggle has been set to No.
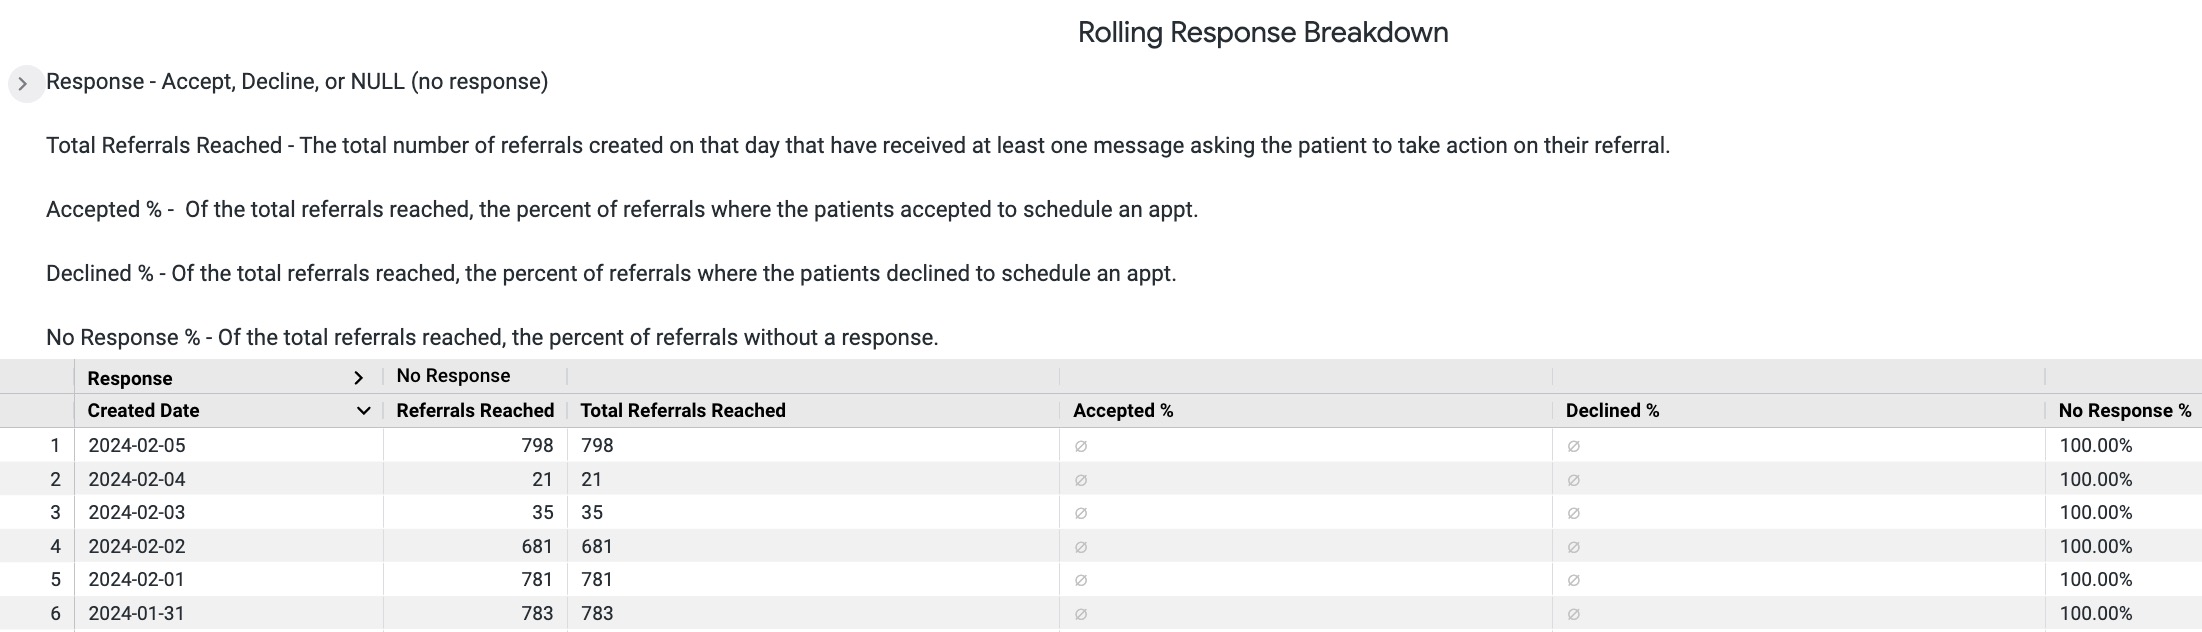
Rolling Response Breakdown
This report and the following tiles are only useful to customers leveraging Conversation Builder for their Referral Automations. They describe the patient referral acceptance through response to the Conversation Builder message.
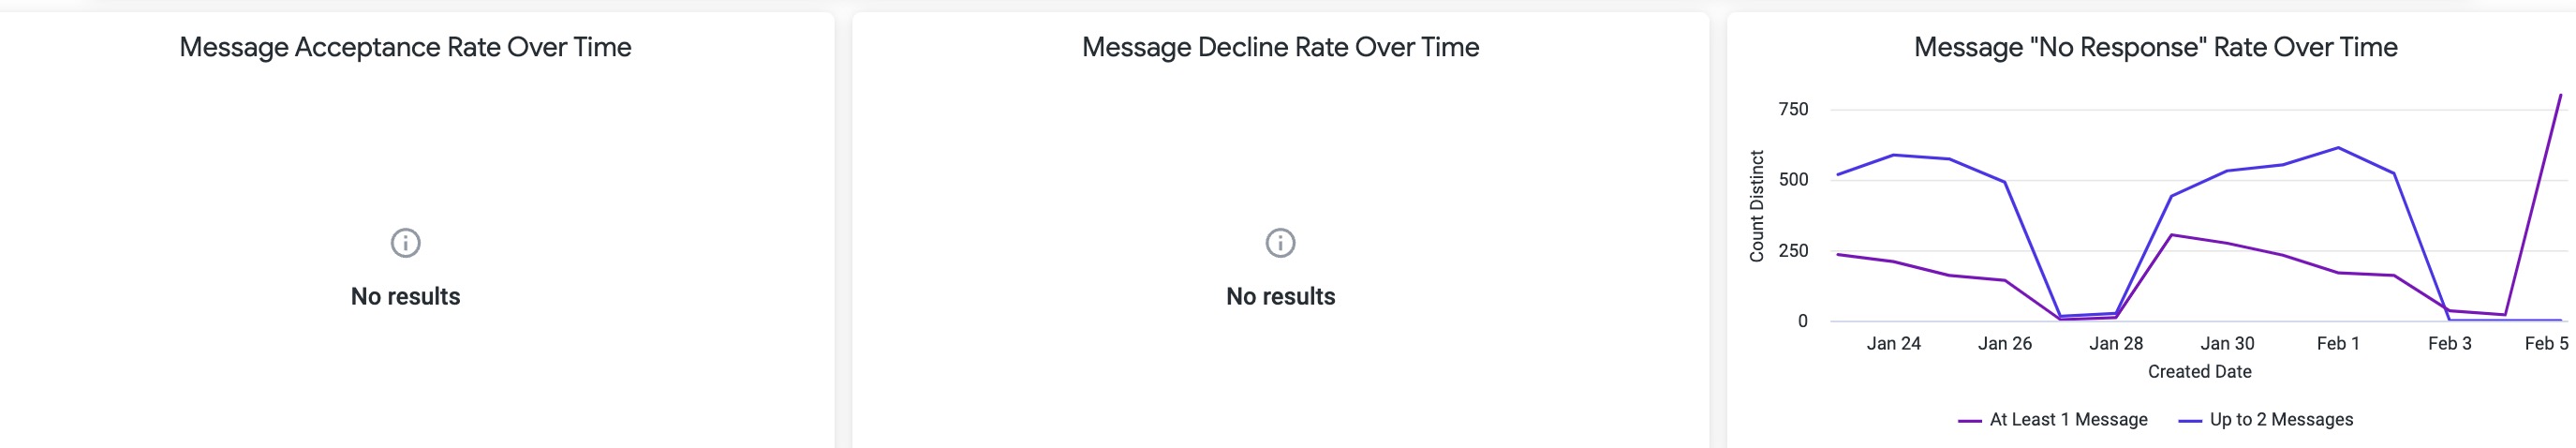
Referral Acceptance Metrics
These tiles speak to the acceptance rates of referrals and how many messages were needed to solicit that response. These reports are useful for customers who leverage Conversation Builder in their referral workflow, otherwise, most data fields will be blank.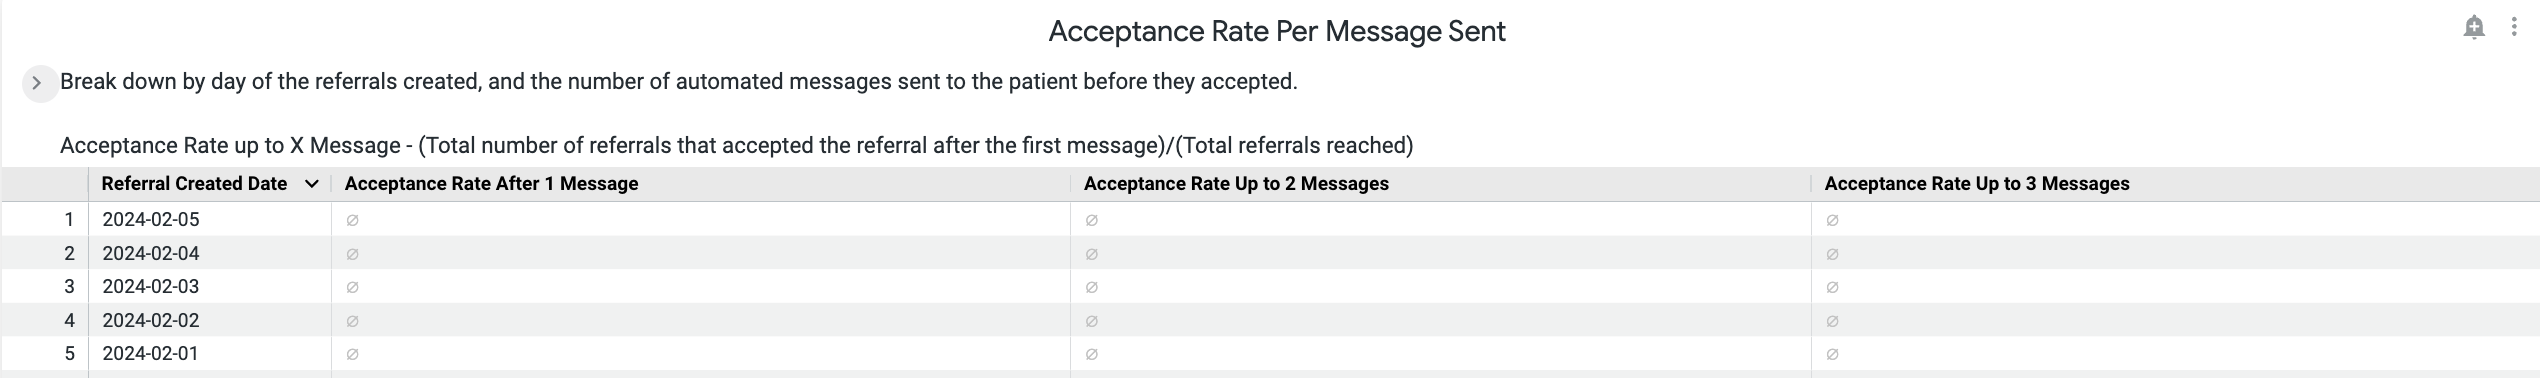
Deliverability Reports
Another report that may be helpful when working with Referral data is Deliverability by Automation. This report is not part of the Referrals Message Performance Dashboard but can be used to further analyze your Referrals outreach data. This report is located in the #Artera Analytics Plus folder.
- Navigate to your Shared Folders and choose the #Artera Analytics Plus Folder.
-
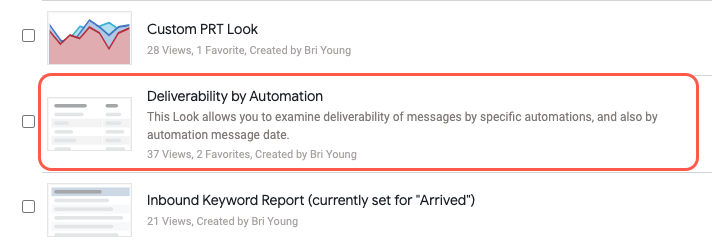
Scroll down to the Looks section and choose Deliverability by Automation. Tip: Use the heart icon to add the report to your Favorites for quicker access.
-
This report displays all Automations within your Enterprise. We recommend that you choose only the Referral Automations that you are interested in from the Automation Current Description Filter.
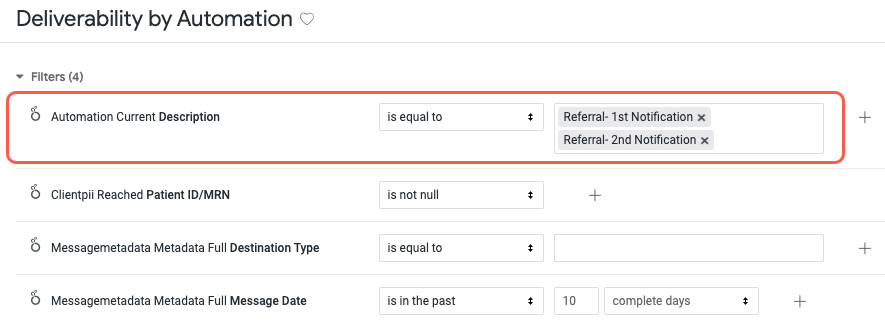
- You may also want to adjust the date range, depending on the timeframe you are looking to report on.
- Click Run to filter the report.
-
Review the status of the message to the patient and determined whether or not it was delivered. It may be helpful to follow up with undelivered and failed patients directly.
Call Statuses
Referral Performance Report
Artera Referrals Management customers with access to Analytics Plus and an active HL7 ZF1-8 feed will also have access to the Referral Performance Dashboard. This report highlights a variety of different data points related to your Referrals outreach, including:
Referrals Sent (Count)
Appointments Scheduled (Count)
Appointments Completed
Scheduled Appointment Conversion Rate
Completed Appointment Conversion Rate
‘Dollars earned’ from completed Referral Appointments
Detail table of Referrals by Specialty
NOTE: This report is only applicable to the following customers:
Those leveraging Artera’s Referrals Management feature for Internal Referrals (Referrals that stay within your health system)
Those who have an HL7 SIU interface set up to trigger updates to Artera when an appointment is scheduled for a patient with an active Referral. Important Consideration: The Appointment ID in the Referral ZF1-8 interface must match the Appointment ID in the HL7 SIU interface
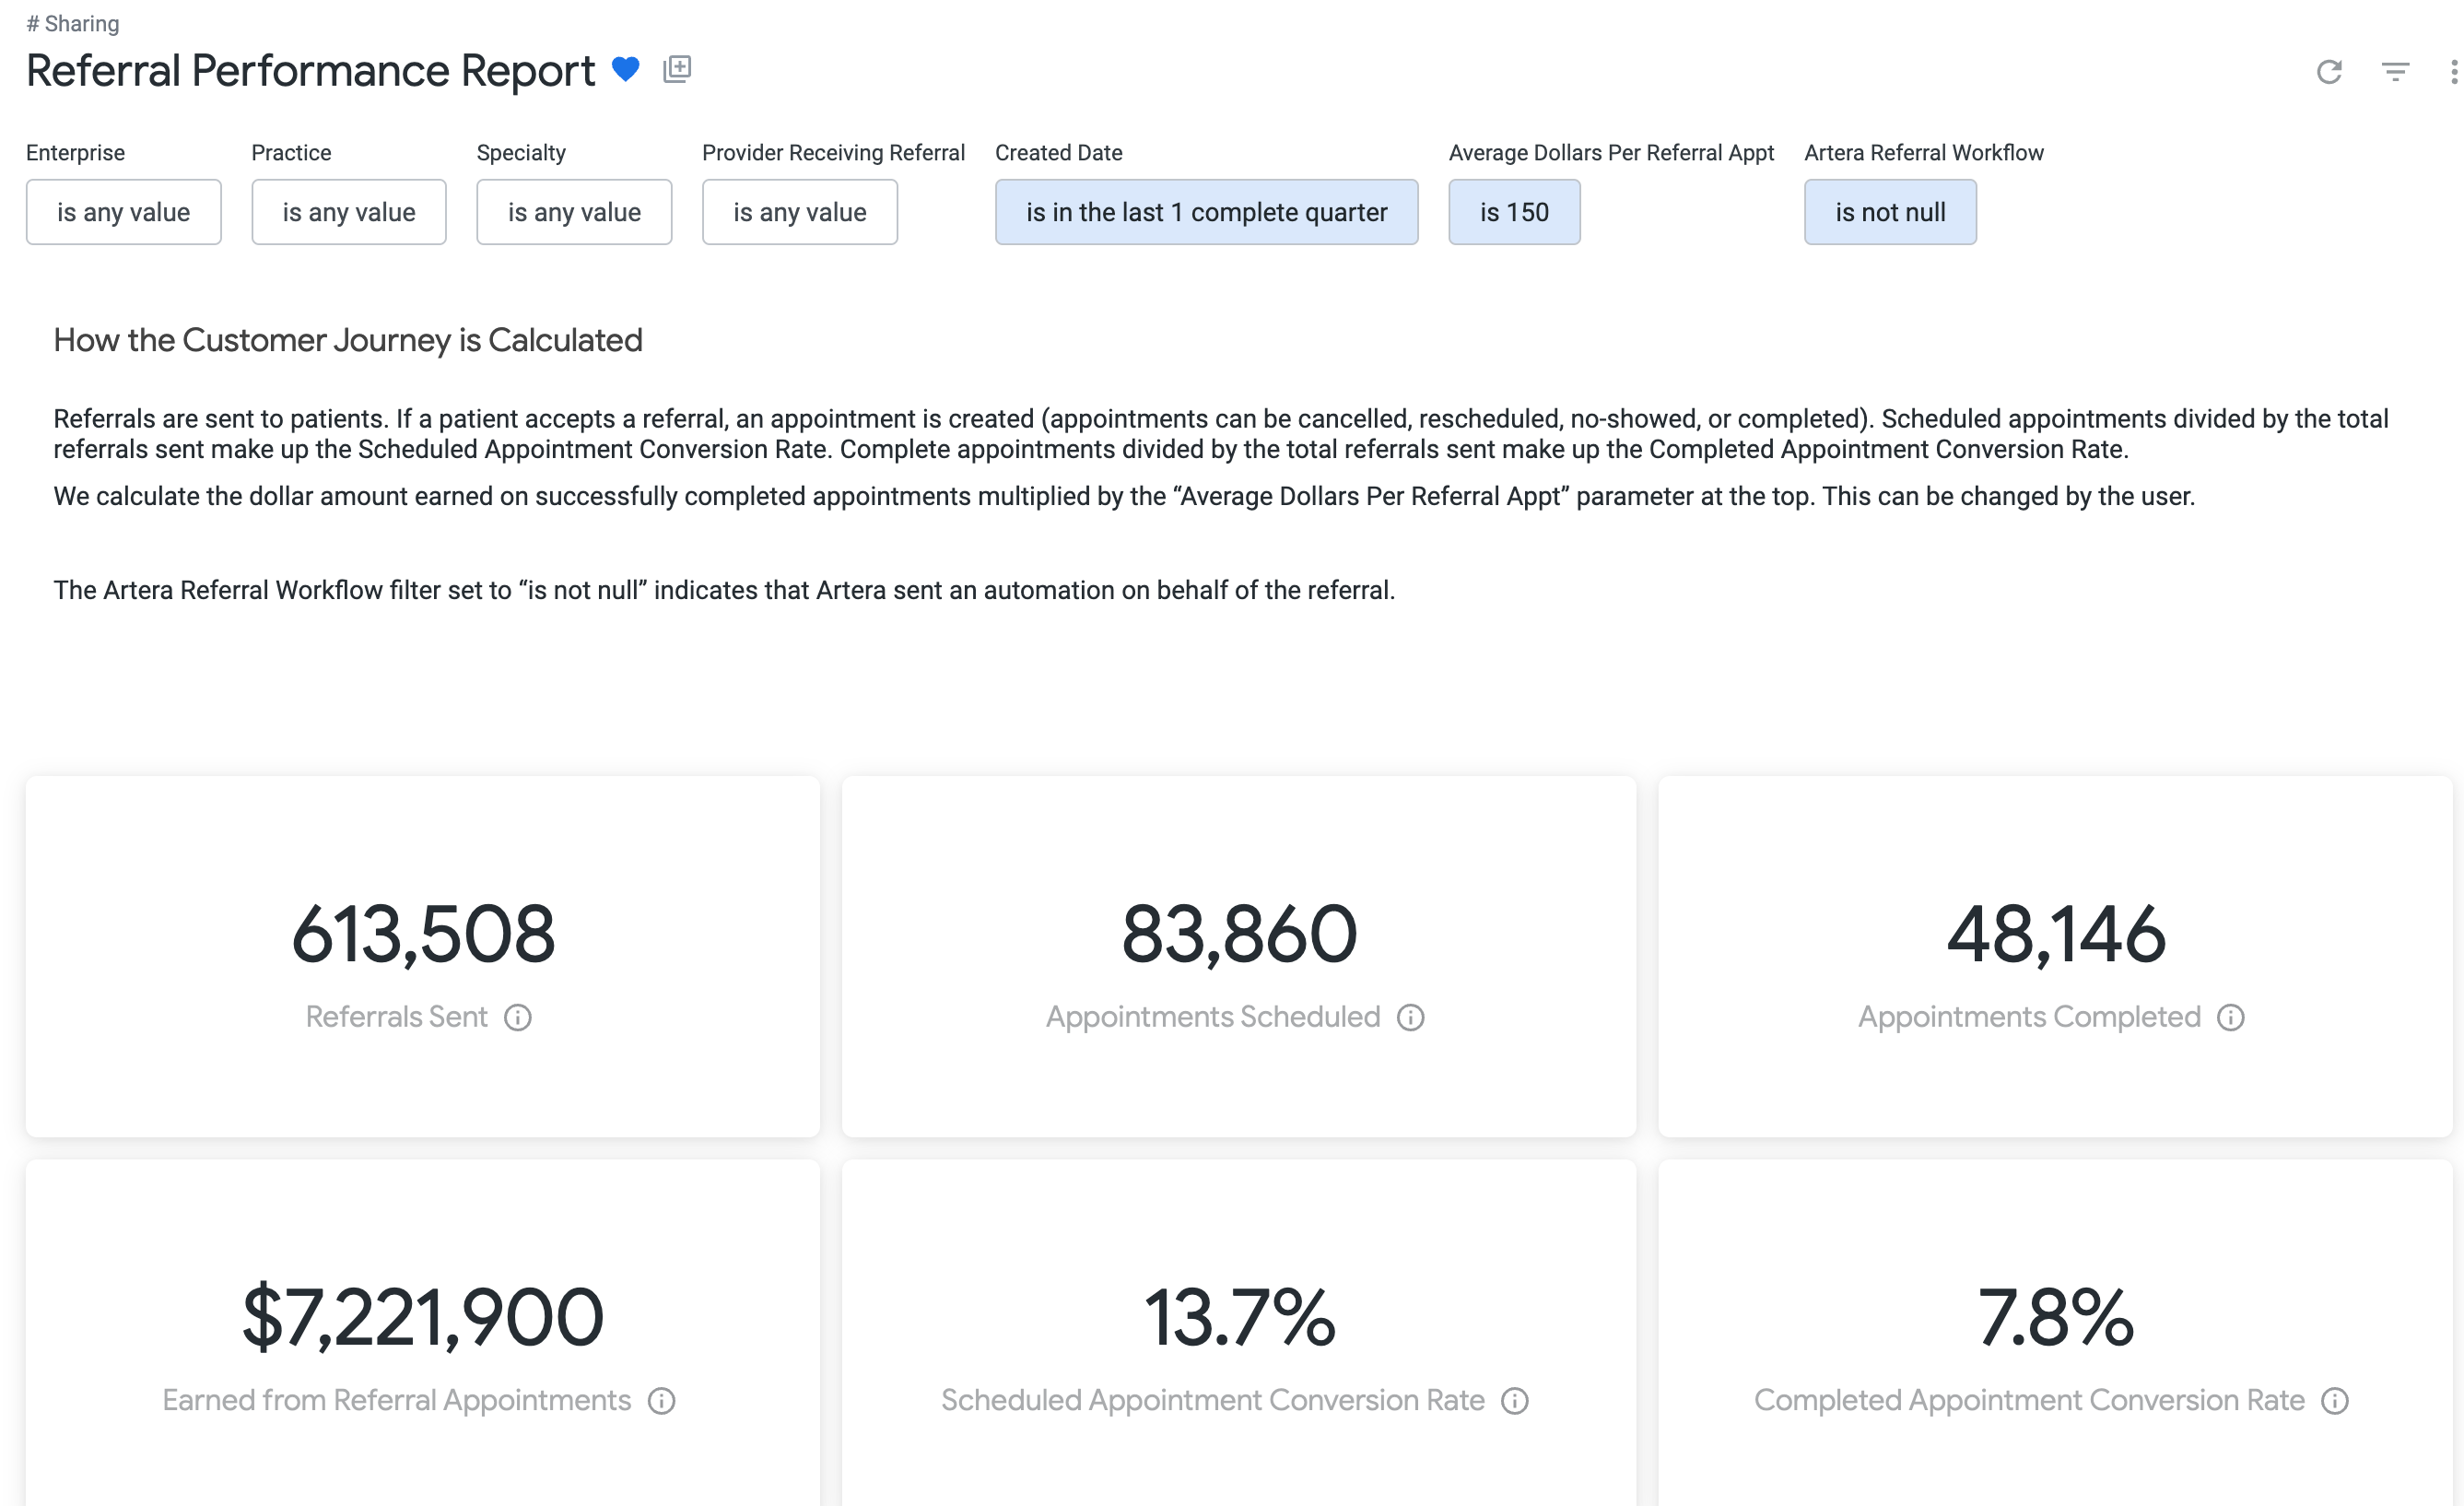
How are these Metrics Calculated?
Referral Sent (Count): The count of distinct Referral IDs for which an Automation was triggered for (Automation ID is not null).
Appointments Scheduled (Count): The count of distinct Referral IDs with either a linked external appointment ID associated or a Scheduling Status of "allVisitsScheduled" or "someVisitsScheduled." Remember, Artera receives appointment statuses via a customer's HL7 ZF1-8 Feed. If this number is low or 0, connect with your Artera Customer Success Representative for troubleshooting.
Appointments Completed: The count of distinct Referral IDs with either an external appointment with the status of "completed" or a Scheduling Status of "allVisitsComplete" or "someVisitsComplete." If this number is low or 0, appointment statuses may not be updated appropriately with a 'completed' status.
Scheduled Appointment Conversion Rate: Scheduled appointments divided by Referral Sent (Count).
Completed Appointment Conversion Rate: Completed appointments divided by Referral Sent (Count).
Dollars Earned: Projected dollar amount earned from completed appointments, calculated from the Appointments Completed count multiplied by the the Average Dollars per Referral Appt parameter.